. 2013 Jan 3;12(1):49-61.
doi: 10.1016/j.stem.2012.10.011.

Regulation of glycolysis by Pdk functions as a metabolic checkpoint for cell cycle quiescence in hematopoietic stem cells

Affiliations

Regulation of glycolysis by Pdk functions as a metabolic checkpoint for cell cycle quiescence in hematopoietic stem cells

Keiyo Takubo et al. Cell Stem Cell. .

Abstract

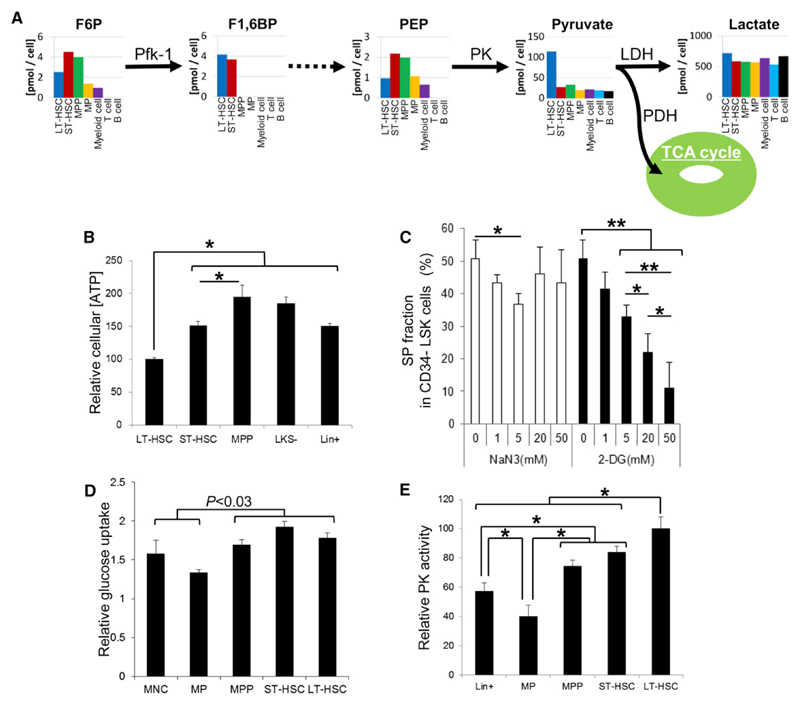
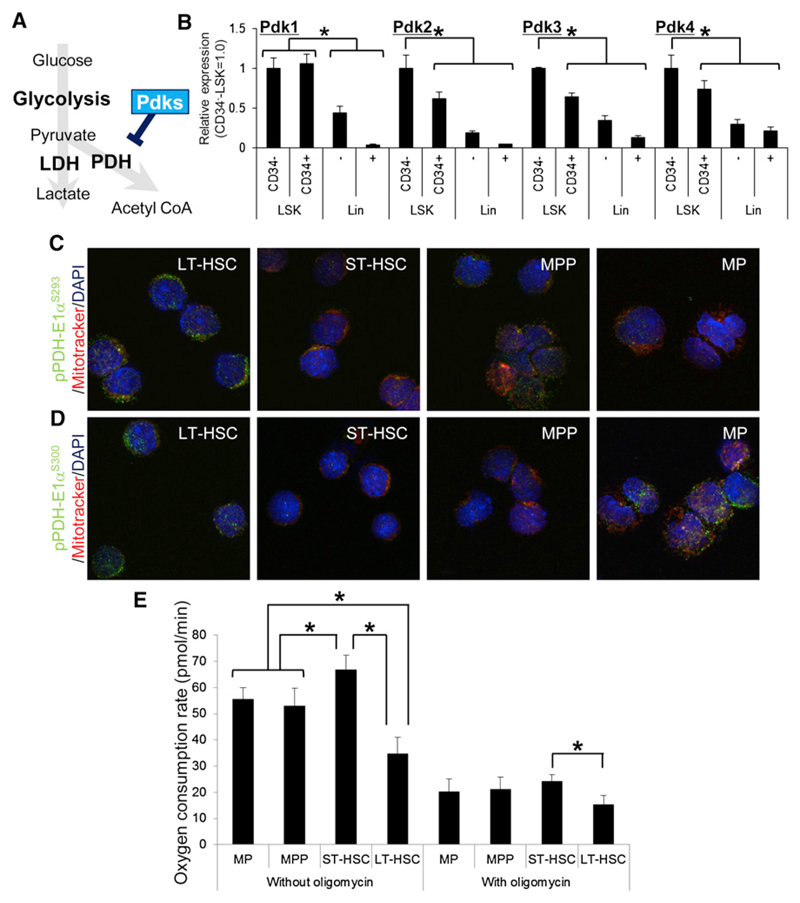
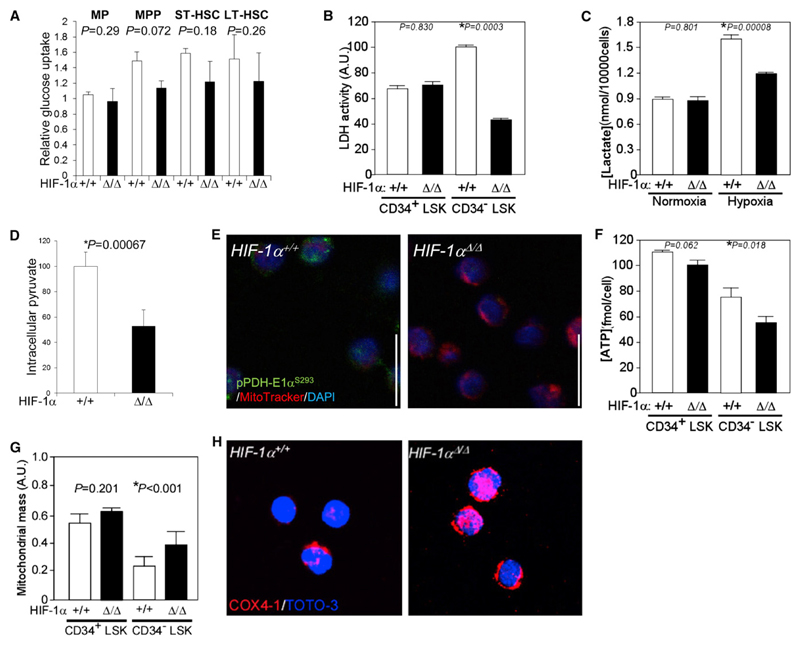
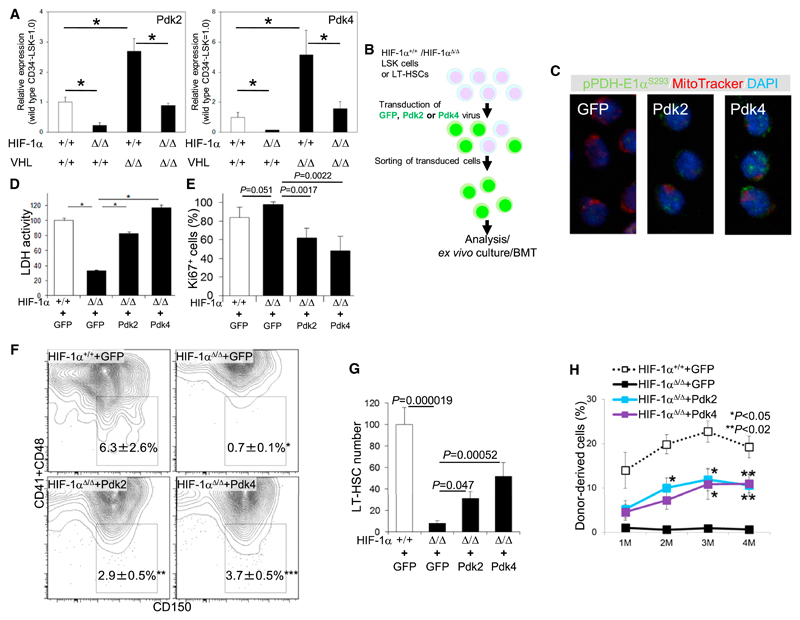
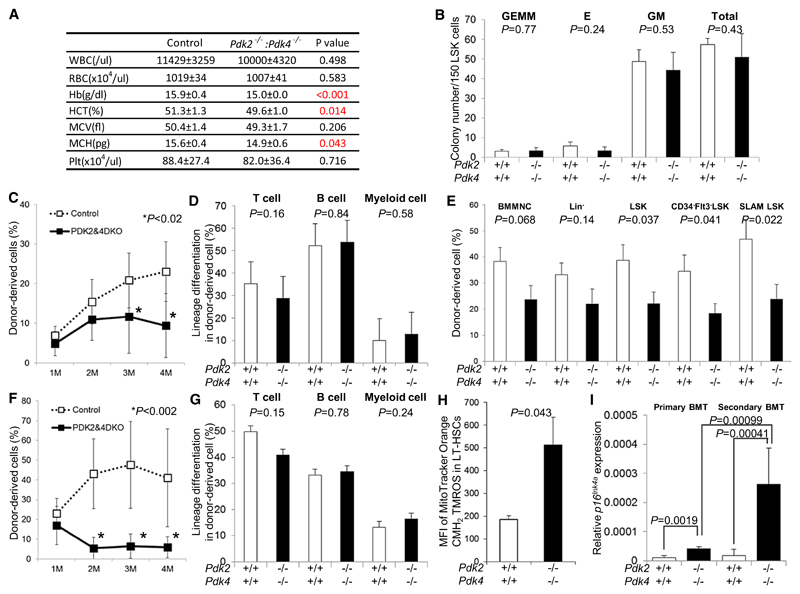
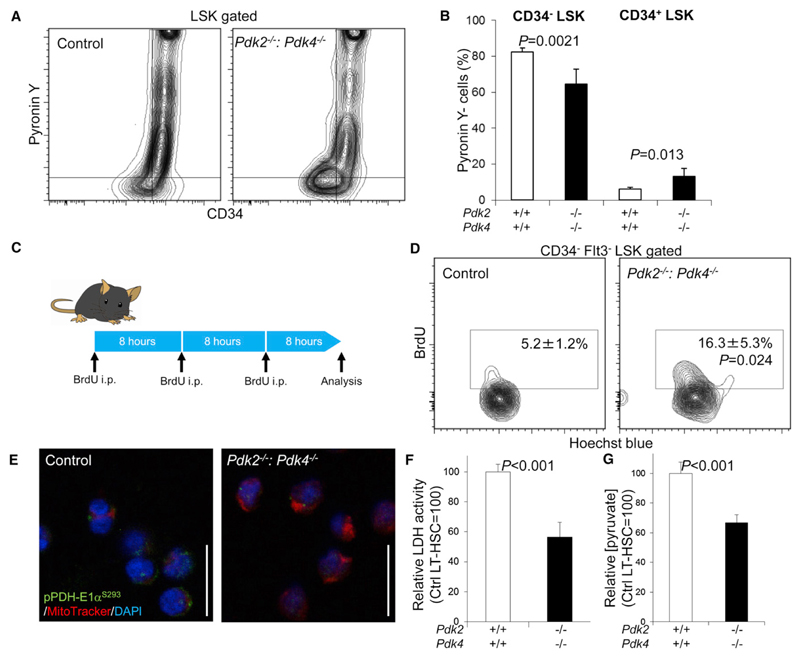
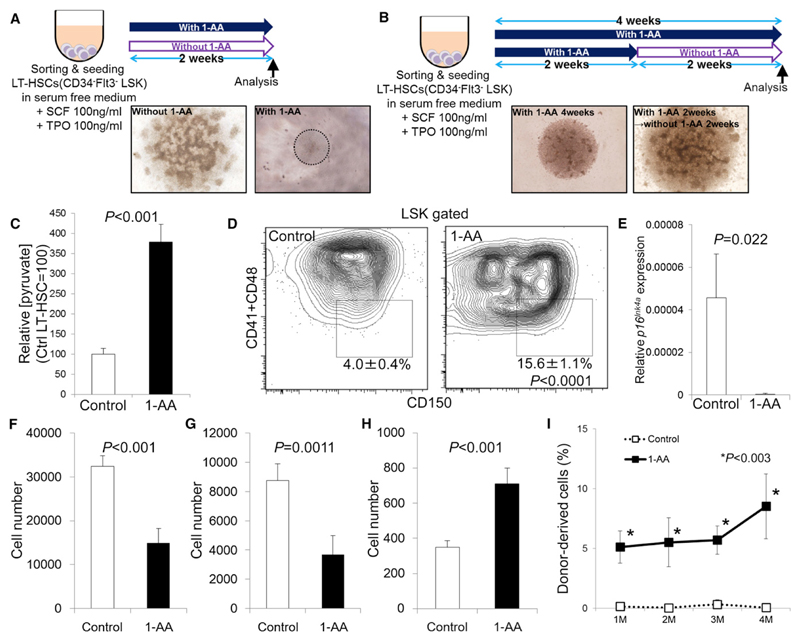
Defining the metabolic programs that underlie stem cell maintenance will be essential for developing strategies to manipulate stem cell capacity. Mammalian hematopoietic stem cells (HSCs) maintain cell cycle quiescence in a hypoxic microenvironment. It has been proposed that HSCs exhibit a distinct metabolic phenotype under these conditions. Here we directly investigated this idea using metabolomic analysis and found that HSCs generate adenosine-5'-triphosphate by anaerobic glycolysis through a pyruvate dehydrogenase kinase (Pdk)-dependent mechanism. Elevated Pdk expression leads to active suppression of the influx of glycolytic metabolites into mitochondria. Pdk overexpression in glycolysis-defective HSCs restored glycolysis, cell cycle quiescence, and stem cell capacity, while loss of both Pdk2 and Pdk4 attenuated HSC quiescence, glycolysis, and transplantation capacity. Moreover, treatment of HSCs with a Pdk mimetic promoted their survival and transplantation capacity. Thus, glycolytic metabolic status governed by Pdk acts as a cell cycle checkpoint that modulates HSC quiescence and function.


Figures

Figure 1
Figure 1. Metabolic Profiling of Glycolytic Metabolism in HSCs and Their Progeny
(A) Quantification of metabolites in glycolytic metabolism based on CE-TOFMS analysis. Bar graphs for independent metabolites plotted in the glycolytic metabolism map are (from left to right): long-term (LT)-hematopoietic stem cells (HSCs) (CD34Flt3 LSK cells; blue bars), short-term (ST)-HSCs (CD34+Flt3 LSK cells; red bars), multipotent progenitors (MPPs) (CD34+Flt3+ LSK cells; green bars), myeloid progenitors (MPs; Lin c-Kit+ Sca-1 cells; yellow bars), Gr-1/Mac-1+ myeloid cells (purple bars), CD4/CD8+ T cells (sky blue bars), and B220+ B lymphocytes (black bars). Data are representative of two independent experiments. (B) Relative intracellular ATP concentrations in LT-HSC, ST-HSC, MPP, LKS, and Lin+ cells (mean ± SD, n = 6, *p < 0.001). (C) Effects of NaN3 (open bars) or 2-DG (closed bars) treatment on the Side Population phenotype of the CD34 LSK fraction at indicated concentrations (mean ± SD, n = 4, *p < 0.05, **p < 0.0002). (D) Relative glucose uptake by LT-HSC, ST-HSC, MPP, MP, and Lin+ cells (mean ± SD, n = 5). (E) Relative PK activity in LT-HSC, ST-HSC, MPP, MP, and Lin+ cells (mean ± SD, n = 6, *p < 0.001). See also Figure S1.
Figure 2
Figure 2. Pdk-Mediated Metabolic Properties of LT-HSCs
(A) Schematic representation of the effect of Pdks on energy metabolism. (B) qPCR analysis of Pdk family members in CD34 LSK, CD34+ LSK, Lin, or Lin+ fractions from 12-week-old mice (mean ± SD, n = 4). Each value was normalized to β-actin expression and is expressed as fold induction compared to levels detected in CD34 LSK samples (*p < 0.01). (C and D) Immunocytochemical staining for phosphorylated S293 (C) or S300 (D) residues of PDH-E1α (green), Mitotracker DeepRed (red), and DAPI (blue) in wild-type LT-HSC (CD34 Flt3 LSK), ST-HSC (CD34+ Flt3 LSK), MPP (CD34+ Flt3+ LSK), or MP (Lineage marker c-Kit+ Sca-1) cells. (E) Oxygen consumption rate in LT-HSC, ST-HSC, MPP, and MP cells treated with or without oligomycin (mean ± SD, n = 6) (*p < 0.001). See also Figure S2.
Figure 3
Figure 3. Loss of HIF-1α Alters HSC Energy Metabolism
(A) Relative glucose uptake by LT-HSC, ST-HSC, MPP, and MP cells from HIF-1α+/+ or HIF-1αΔ/Δ mice (mean ± SD, n = 4). (B) LDH activity in CD34+ or CD34 LSK cells from HIF-1α+/+ or HIF-1αΔ/Δ mice (mean ± SD, n = 4). Arbitrary units (a.u.) were calculated as the value relative to LDH activity in the HIF-1α+/+ CD34 LSK fraction (set to 100; *p < 0.01). (C) Lactate production in CD34 LSK cells under normoxic (20% O2) or hypoxic (1% O2) conditions per ten thousand cells (mean ± SD, n = 4; *p < 0.01). (D) Relative intracellular pyruvate concentrations in LT-HSCs from HIF-1α+/+ or HIF-1αΔ/Δ mice (mean ± SD, n = 4; *p < 0.01). (E) Immunocytochemical staining for phosphorylated S293 residues of PDH-E1α (green), mitochondrial dye Mitotracker DeepRed (red), and DAPI (blue) in HIF-1α+/+ or HIF-1αΔ/Δ LT-HSCs. (F) Intracellular ATP concentration in CD34+ or CD34 LSK cells from HIF-1α+/+ or HIF-1αΔ/Δ mice (mean ± SD, n = 3; *p < 0.05). (G) Relative mitochondrial mass (mitochondrial fluorescence/nuclear fluorescence) in individual HIF-1αΔ/Δ CD34+ or CD34 LSK cells (n = 50). Data are presented as the mean ± SD (*p < 0.001). (H) Immunocytochemical staining of CD34 LSK cells for COX4-1 (red) and TOTO-3 (blue). See also Figure S3.
Figure 4
Figure 4. HIF-1α Maintains Pdk Expression, Glycolysis, and Transplantation Capacity in HSCs
(A) qPCR analysis of Pdk2 and Pdk4 expression in the LT-HSC fraction of 12-week-old HIF-1α+/+, HIF-1αΔ/Δ, VHLΔ/Δ BM, or HIF-1αΔ/Δ:VHLΔ/Δ BM mice (n = 4). Values are normalized to β-actin expression and expressed as fold induction compared to levels detected in HIF-1α+/+ samples (mean ± SD, n = 4, *p < 0.01). (B) Design of retroviral rescue of Pdk expression in HIF-1αΔ/Δ LSK cells. (C) Immunocytochemical staining for phosphorylated S293 residues of PDH-E1α (green), Mitotracker DeepRed (red), and DAPI (blue) in HIF-1αΔ/Δ LT-HSCs transduced with GFP, Pdk2, or Pdk4 retroviruses. (D) Intracellular LDH activity in GFP virus-transduced HIF-1α+/+ LSK cells or in HIF-1αΔ/Δ LSK cells transduced with GFP, Pdk2, or Pdk4 retroviruses (mean ± SD, n = 5, *p < 0.000001). (E) Immunocytochemical assessment of Ki67+ in LSK cells transduced with Pdks for 48 hr on a HIF-1α+/+ or HIF-1αΔ/Δ background (mean ± SD, n = 5). (F) CD150+CD41CD48 LSK cells after transduction with GFP, Pdk2, or Pdk4 retroviruses and then 7 days of culture under hypoxia (mean ± SD, n = 3, *p < 0.05). (G) Quantification of total cell number of CD150+CD41CD48 LSK cells analyzed in (F). (H) PB chimerism of HIF-1αΔ/Δ donor cells transduced with Pdk viruses at 1, 2, 3 and 4 months (M) after BMT (mean ± SEM, n = 5, *p < 0.05, **p < 0.02; compared to HIF-1αΔ/Δ+GFP virus). See also Figure S4.
Figure 5
Figure 5. Defective Maintenance of Pdk2–/–: Pdk4–/– HSCs after Transplantation
(A) PB counts in control and Pdk2−/−: Pdk4−/− mice (mean ± SD, n = 7). (B) Colony-forming capacity of control (open bars) and Pdk2−/−: Pdk4−/− LSK cells (closed bars) (mean ± SD, n = 3). CFU-GEMM, CFU-E, CFU-GM, and total colony numbers are indicated. (C) PB chimerism in primary BMT recipients of control (open boxes) or Pdk2−/−: Pdk4−/− LT-HSC (closed boxes) cells at 1, 2, 3 and 4 months (M) after BMT (mean ± SD, n = 10). (D) Differentiation status (CD4/CD8+ T cells, B220+ B cells, or Mac-1/Gr-1+ myeloid cells) of donor-derived (Ly5.2+) PB cells in primary BMT recipients of control (open bars) or Pdk2−/−: Pdk4−/− (closed bars) LT-HSCs (mean ± SD, n = 10). (E) Donor-derived (Ly5.2+) BM MNC, Lin, LSK, CD34Flt3 LSK, or SLAM-LSK chimerism in primary BMT recipients of control (open bars) or Pdk2−/−: Pdk4−/− (closed bars) LT-HSCs 4 months after primary BMT (mean ± SEM, n = 10). (F) PB chimerism in secondary recipients of BM derived from primary recipients of control (open boxes) or Pdk2−/−: Pdk4−/− (closed boxes) MNCs, at indicated times after BMT (mean ± SD, n = 10). (G) Differentiation status (CD4/CD8+ T cells, B220+ B cells, or Mac-1/Gr-1+ myeloid cells) of donor-derived (Ly5.2+) PB cells in secondary BMT recipients of control (open bars) or Pdk2−/−: Pdk4−/− (closed bars) cells (mean ± SD, n = 10). (H) Redox-sensitive MitoTracker fluorescence in control (open bars) or Pdk2−/−: Pdk4−/− (closed bars) BM LT-HSCs (n = 3, mean ± SD). (I) Quantitative PCR analysis of p16Ink4a expression in control (open bars) or Pdk2−/−: Pdk4−/− (closed bars) donor-derived LT-HSCs 4 months after primary BMT (n = 4). Values are normalized to β-actin expression and expressed as fold induction compared to levels detected in HIF-1α+/+ Ly5.2+ LSK samples (mean ± SD). See also Figure S5.
Figure 6
Figure 6. Loss of Cell Cycle Quiescence and Glycolytic Capacity in Pdk2–/–: Pdk4–/– HSCs
(A) Representative flow cytometric plot of Pyronin Y analysis in the LSK-gated fraction of control or Pdk2−/−: Pdk4−/− BM MNCs. (B) Summary of flow cytometric Pyronin Y analysis of CD34 LSK or CD34+ LSK fractions in control or Pdk2−/−: Pdk4−/− BM MNCs (mean ± SD, n = 6). (C) Design of short-term BrdU labeling assay in control or Pdk2−/−: Pdk4−/− mice. (D) Representative flow cytometric plot showing BrdU labeling of the LT-HSC-gated fraction from control or Pdk2−/−: Pdk4−/− BM MNCs. Numbers indicate the frequency of the BrdU+ fraction in LT-HSCs (mean ± SD, n = 3). (E) Immunocytochemical staining for the phosphorylated S293 residue of PDH-E1α (green), Mitotracker DeepRed (red), and DAPI (blue) in control or Pdk2−/−: Pdk4−/− LT-HSCs. (F) LDH activity in LT-HSCs from control or Pdk2−/−: Pdk4−/− mice (mean ± SD, n = 4). Shown are arbitrary values calculated as the value relative to LDH activity in the control LT-HSC fraction (set to 100). (G) Intracellular pyruvate concentration in LT-HSCs from control or Pdk2−/−: Pdk4−/− mice (mean ± SD, n = 3). Shown are arbitrary values calculated as the value relative to intracellular pyruvate levels in the control LT-HSC fraction (set to 100). See also Figure S6.
Figure 7
Figure 7. Modulation of HSC Cell Cycle Quiescence by a PDH Inhibitor
(A) Design of LT-HSC cultures treated with or without 1-AA for 2 weeks. Light microscopic data show colony morphology. (B) Effect of 1-AA withdrawal on LT-HSCs after 2 weeks of treatment. Light microscopic colony morphology after 4 weeks of culture. (C) Intracellular pyruvate concentrations in LT-HSCs treated with or without 1-AA for 4 days (mean ± SD, n = 3). Shown are arbitrary values calculated as the value relative to intracellular pyruvate in the control LT-HSC fraction (set to 100). (D) Flow cytometric analysis of LT-HSCs treated with or without 1-AA in vitro for 4 weeks. Numbers indicate the LT-HSC fraction in LSK cells (mean ± SD, n = 4). (E) Quantitative PCR analysis of p16Ink4a expression in control (open bars) or 1-AA-treated (closed bars) LT-HSCs 2 weeks after culture with or without 1-AA (n = 4). Values are normalized to β-actin expression and expressed as fold induction compared to levels detected in control samples (mean ± SD). (F–H) Quantification of total cells (F), LSK cells (G), or LT-HSCs (H) from LT-HSC-derived colonies in the absence (control) or presence of 1-AA for 4 weeks in vitro (mean ± SD, n = 4). (I) Donor-derived (Ly5.1+) PB chimerism in BMT recipients of control LT-HSCs or LT-HSCs treated with 1-AA for 4 weeks, at indicated times after BMT (mean ± SD, n = 4–5). See also Figure S7.

Comment in

  • Stem cells: A metabolic switch.
    Baumann K. Baumann K. Nat Rev Mol Cell Biol. 2013 Feb;14(2):64-5. doi: 10.1038/nrm3515. Nat Rev Mol Cell Biol. 2013. PMID: 23340568 No abstract available.

References

    1. Allen C, Büttner S, Aragon AD, Thomas JA, Meirelles O, Jaetao JE, Benn D, Ruby SW, Veenhuis M, Madeo F, Werner-Washburne M. Isolation of quiescent and nonquiescent cells from yeast stationary-phase cultures. J Cell Biol. 2006;174:89–100. - PMC - PubMed
    1. Arai F, Hirao A, Ohmura M, Sato H, Matsuoka S, Takubo K, Ito K, Koh GY, Suda T. Tie2/angiopoietin-1 signaling regulates hematopoietic stem cell quiescence in the bone marrow niche. Cell. 2004;118:149–161. - PubMed
    1. DeBerardinis RJ, Lum JJ, Hatzivassiliou G, Thompson CB. The biology of cancer: metabolic reprogramming fuels cell growth and proliferation. Cell Metab. 2008;7:11–20. - PubMed
    1. Dunford EC, Herbst EA, Jeoung NH, Gittings W, Inglis JG, Vandenboom R, LeBlanc PJ, Harris RA, Peters SJ. PDH activation during in vitro muscle contractions in PDH kinase 2 knockout mice: effect of PDH kinase 1 compensation. Am J Physiol Regul Integr Comp Physiol. 2011;300:R1487–R1493. - PubMed
    1. Fukuda R, Zhang H, Kim JW, Shimoda L, Dang CV, Semenza GL. HIF-1 regulates cytochrome oxidase subunits to optimize efficiency of respiration in hypoxic cells. Cell. 2007;129:111–122. - PubMed

Publication types

Substances