. 2013 Jan 3;12(1):62-74.
doi: 10.1016/j.stem.2012.11.022.

Metabolic regulation by the mitochondrial phosphatase PTPMT1 is required for hematopoietic stem cell differentiation

Affiliations

Metabolic regulation by the mitochondrial phosphatase PTPMT1 is required for hematopoietic stem cell differentiation

Wen-Mei Yu et al. Cell Stem Cell. .

Abstract

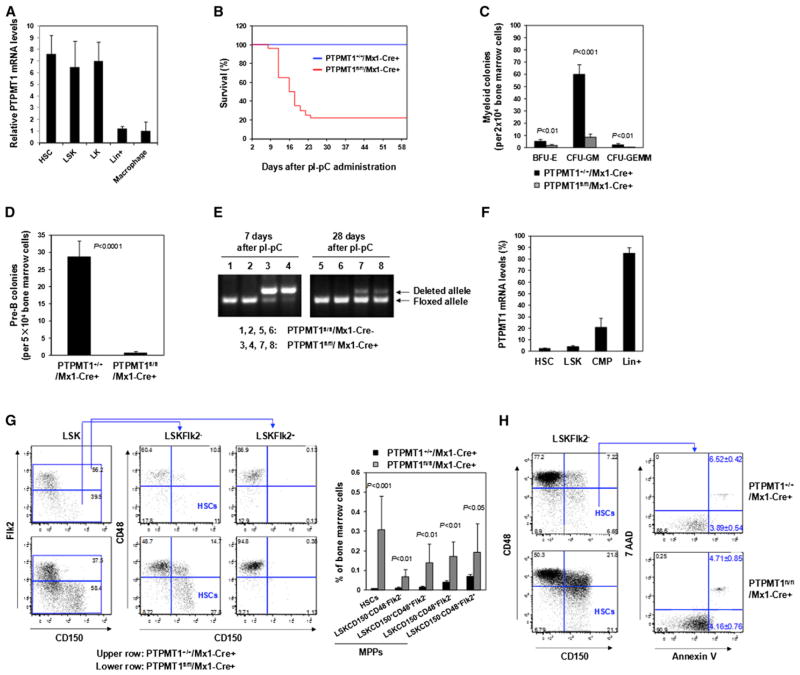
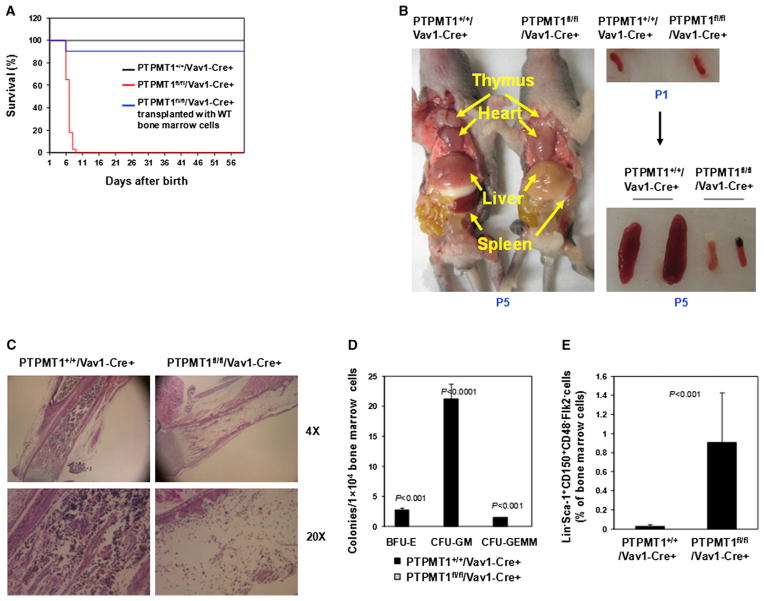
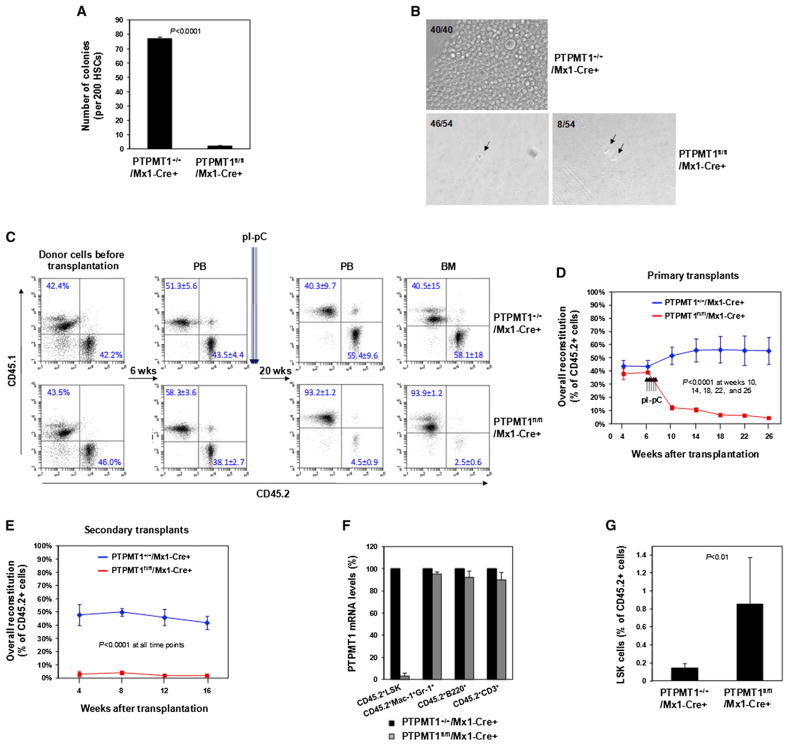
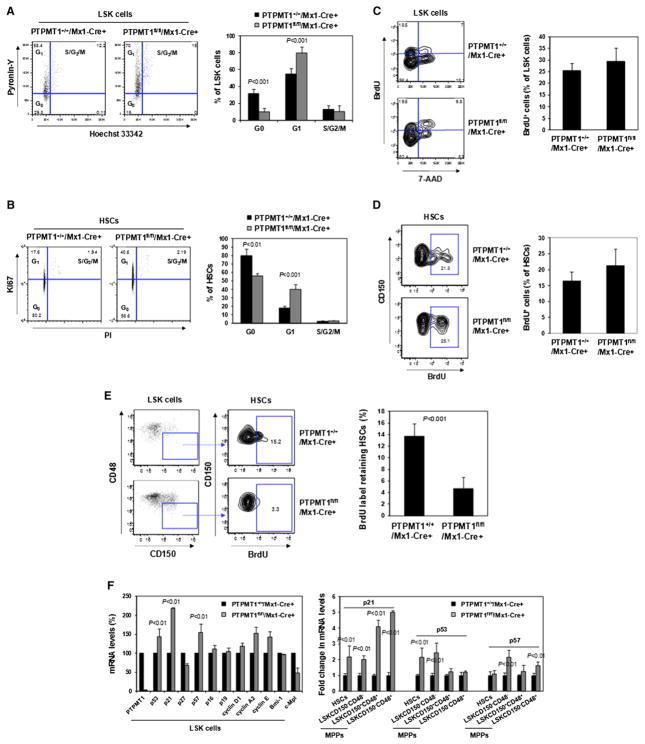
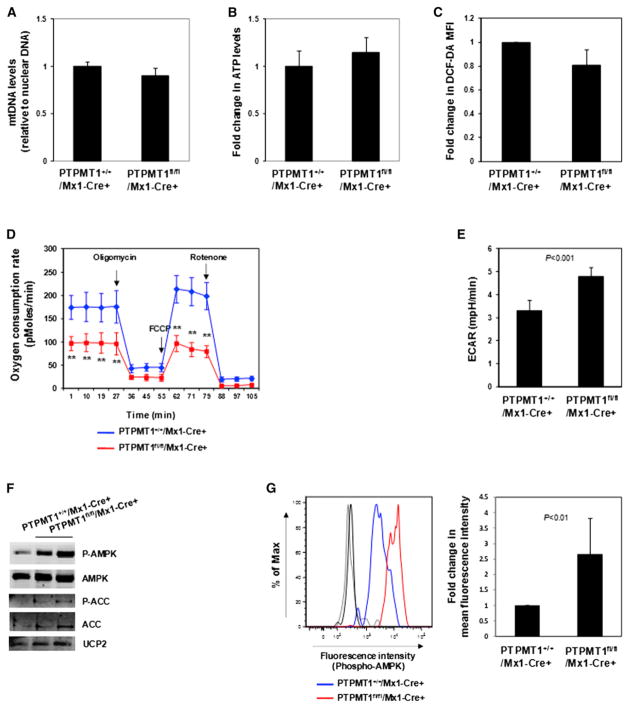
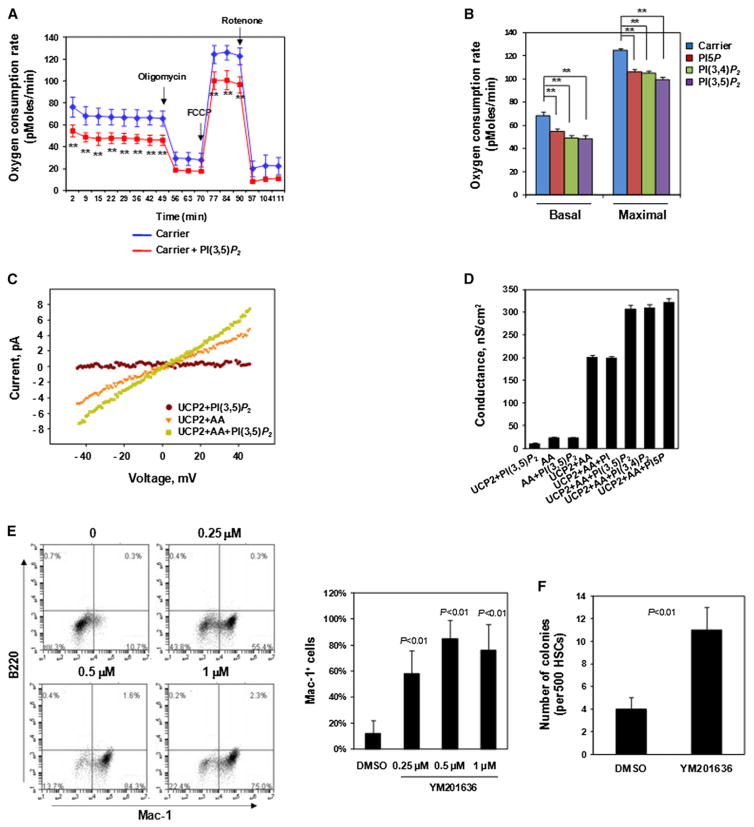
The regulation and coordination of mitochondrial metabolism with hematopoietic stem cell (HSC) self-renewal and differentiation is not fully understood. Here we report that depletion of PTPMT1, a PTEN-like mitochondrial phosphatase, in inducible or hematopoietic-cell-specific knockout mice resulted in hematopoietic failure due to changes in the cell cycle and a block in the differentiation of HSCs. Surprisingly, the HSC pool was increased by ∼40-fold in PTPMT1 knockout mice. Reintroduction of wild-type PTPMT1, but not catalytically deficient PTPMT1 or truncated PTPMT1 lacking mitochondrial localization, restored differentiation capabilities of PTPMT1 knockout HSCs. Further analyses demonstrated that PTPMT1 deficiency altered mitochondrial metabolism and that phosphatidylinositol phosphate substrates of PTPMT1 directly enhanced fatty-acid-induced activation of mitochondrial uncoupling protein 2. Intriguingly, depletion of PTPMT1 from myeloid, T lymphoid, or B lymphoid progenitors did not cause any defects in lineage-specific knockout mice. This study establishes a crucial role of PTPMT1 in the metabolic regulation of HSC function.


Figures

Figure 1
Figure 1. PTPMT1 Depletion Results in Hematopoietic Failure While the Stem Cell Pool Is Drastically Expanded in Adult PTPMT1 Conditional Knockout Mice
(A) HSC (LineageSca-1+c-Kit+CD150+CD48Flk2), LSK (LineageSca-1+c-Kit+), LK (LineageSca-1c-Kit+), and Lineage+ cells were sorted from mouse BM cells (n = 3/group). Macrophages were generated from BM cells as described in the Supplemental Information. Total RNA was extracted and PTPMT1 mRNA levels were determined by quantitative reverse transcription PCR (RT-PCR). (B) Four-week-old PTPMT1fl/fl/Mx1-Cre+ and PTPMT1+/+/Mx1-Cre+ littermates (n = 30/group) were treated by intraperitoneal injection of pI-pC. Animal survival rates were determined. (C and D) BM cells were harvested from PTPMT1fl/fl/Mx1-Cre+ and PTPMT1+/+/Mx1-Cre+ mice (n = 5/group) 2 weeks after pI-pC treatment and assessed for myeloid (C) and B lymphoid (D) progenitors by CFU assays. (E) Peripheral blood was collected from PTPMT1fl/fl/Mx1-Cre+ and PTPMT1+/+/Mx1-Cre+ mice 1 and 4 weeks after pI-pC treatment. Genomic DNA was extracted from white blood cells and subjected to PCR genotyping. (F) BM cells were harvested from PTPMT1fl/fl/Mx1-Cre+ and PTPMT1+/+/Mx1-Cre+ mice (n = 3/group) 4 weeks following pI-pC treatment. HSCs, LSK cells, CMPs (LineageSca-1c-Kit+CD34+CD16/32low), and Lineage+ cells were isolated. Total RNA was extracted and PTPMT1 mRNA levels were determined by quantitative RT-PCR. (G and H) BM cells freshly harvested from PTPMT1fl/fl/Mx1-Cre+ and PTPMT1+/+/Mx1-Cre+ littermates 4 weeks following pI-pC treatment were assayed by multiparameter FACS analyses to determine frequencies of HSCs and MPPs (LineageSca-1+c-Kit+CD150CD48Flk2, LineageSca-1+c-Kit+CD150+ CD48+Flk2, LineageSca-1+c-Kit+CD150CD48+Flk2, and LineageSca-1+c-Kit+CD150CD48+Flk2+) (n = 9/group) (G), and frequencies of early (Annexin V+/7-AAD) and late (Annexin V+/7-AAD+) apoptotic cells in HSCs (n = 5/group) (H). Data shown in (A), (C), (D), and (F)–(H) are presented as mean ± SD. Also see Figure S1.
Figure 2
Figure 2. Hematopoietic-Cell-Specific PTPMT1 Knockout Mice Fail to Establish Postnatal Hematopoiesis
(A) Survival rates of PTPMT1fl/fl/Vav1-Cre+ (n = 50), PTPMT1+/+/Vav1-Cre+ (n = 50), and PTPMT1fl/fl/Vav1-Cre+ (n = 12) mice transplanted with WT BM cells were determined. Newborn PTPMT1fl/fl/Vav1-Cre+ pups were transplanted with BM cells (1 × 10⁵) from WT pups by intravenous (superficial temporal vein) injection. (B) Postnatal day 5 (P5) PTPMT1fl/fl/Vav1-Cre+ and PTPMT1+/+/Vav1-Cre+ neonates were dissected and photographed. Spleens dissected from P1 and P5 pups are shown on the right panel. (C) Femurs isolated from P5 PTPMT1fl/fl/Vav1-Cre+ and PTPMT1+/+/Vav1-Cre+ pups were processed for histopathological examination (hematoxylin and eosin staining). (D) BM cells harvested from P3 PTPMT1fl/fl/Vav1-Cre+ and PTPMT1+/+/Vav1-Cre+ littermates (n = 5/group) were assessed by CFU assays to determine myeloid progenitors. (E) BM cells harvested from P3 to P5 PTPMT1fl/fl/Vav1-Cre+ and PTPMT1+/+/Vav1-Cre+ littermates (n = 8/group) were assayed by multiparameter FACS analyses to determine the frequency of LineageSca-1+CD150+CD48Flk2 cells. Data shown in (D) and (E) are presented as mean ± SD. Also see Figure S2.
Figure 3
Figure 3. Repopulating Capabilities of PTPMT1-Depleted HSCs Are Blocked
(A) HSCs were sorted from PTPMT1fl/fl/Mx1-Cre+ and PTPMT1+/+/Mx1-Cre+ mice (n = 3/group) 4 weeks after pI-pC treatment and assessed by the CFU assay. Colonies were counted 12 days later. (B) Sorted HSCs were individually deposited into 96-well plates and cultured in Thrombopoietin (TPO) (50 ng/ml), Flt3 ligand (50 ng/ml), stem cell factor (SCF) (50 ng/ml), IL-3 (25 ng/ml), and IL-6 (20 ng/ml) containing medium for 7 days. The numbers of the wells containing 1, 2, or confluent cells were documented. Representative data from three independent experiments are shown. (C and D) BM cells (1 × 10⁶) (test cells) harvested from PTPMT1fl/fl/Mx1-Cre+ and PTPMT1+/+/Mx1-Cre+ mice (CD45.2+) (without pI-pC treatment) were mixed with the same number of BoyJ (CD45.1+) BM cells and transplanted into lethally irradiated BoyJ recipients (n = 9/group). Six weeks following transplantation, recipient mice were treated with pI-pC. Test cell reconstitution (CD45.2+ cells) in peripheral blood and BM cells was determined by FACS analyses 4, 8, 12, 16, and 20 weeks after pI-pC treatment. Representative FACS data are shown in (C) with summarized data shown in (D). (E) BM cells harvested from primary recipients 20 weeks after pI-pC administration were transplanted into lethally irradiated secondary BoyJ recipient mice (2 × 10⁶ cells/mouse) (n = 7/group). Test cell reconstitution in peripheral blood was determined 4, 8, 12, and 16 weeks after transplantation. (F) CD45.2+LSK, CD45.2+Mac-1+Gr-1+, CD45.2+B220+, and CD45.2+CD3+ cells were sorted from the BM of primary transplants (n = 3/group). Total RNA was extracted and PTPMT1 mRNA levels were determined by quantitative RT-PCR. (G) Frequencies of LSK cells in the test-cell-derived (CD45.2+) cell populations in primary recipient mice (n = 5/group) were quantified by multiparameter FACS analyses 20 weeks following pI-pC treatment. Data shown in (A) and (C)–(G) are presented as mean ± SD. Also see Figure S3.
Figure 4
Figure 4. Catalytic Activity and Mitochondrial Localization Are Required for PTPMT1 Function in HSCs
(A) BM cells freshly harvested from PTPMT1fl/fl/Mx1-Cre+ mice (without pI-pC treatment) were transduced with WT PTPMT1, PTPMT1 C132S, PTPMT1 Δ37, and control vector through retro-viral-mediated gene transfer. Transduced cells were sorted by FACS based on the expression of the GFP marker contained in the retroviral vector (MSCV-IRES-GFP). Sorted cells (test cells) were transplanted with the same number of the BM cells (competitor cells) isolated from BoyJ mice that had undergone the same culture procedures into lethally irradiated BoyJ recipients (n = 10/group). Six weeks after transplantation, recipient animals were treated with pI-pC. Test cell reconstitution was determined 16 weeks after the last dose of pI-pC. (B) Embryonic day 15.5 (E.15.5) fetal liver cells freshly harvested from PTPMT1fl/fl/Vav1-Cre+ embryos were transduced with WT PTPMT1, PTPMT1 C132S, PTPMT1 Δ37, and vector control. Transduced cells (1 × 10⁶ cells with around 20% transduction efficiency) were transplanted into lethally irradiated BoyJ recipients. Survival curves of recipient animals were determined (n = 10/group). Data shown in (A) are presented as mean ± SD.
Figure 5
Figure 5. PTPMT1-Depleted HSCs Are Delayed at the G1 Phase of the Cell Cycle
(A and B) BM cells freshly harvested from PTPMT1fl/fl/Mx1-Cre+ and PTPMT1+/+/Mx1-Cre+ mice 4 weeks following pI-pC treatment were assayed to determine the cell cycle status of LSK cells (A, n = 9/group) and HSCs (B, n = 8/group). Percentages of LSK cells (A) and HSCs (B) at G0, G1, and S/G2/M phases were quantified. (C and D) PTPMT1fl/fl/Mx1-Cre+ and PTPMT1+/+/Mx1-Cre+ mice (n = 5/group) were injected i.p. with BrdU (1.0 mg/6.0 g body weight) 4 weeks following pI-pC treatment. Mice were sacrificed 16 hr later. BM cells were isolated and stained with antibodies against the indicated cell surface markers. BrdU staining was performed using the FTIC BrdU Flow Kit (BD Biosciences). Cells were then stained with the DNA dye 7-amino-actinomycin D (7-AAD) and subjected to FACS analyses so that percentages of BrdU+ cells in the LSK (C) and HSC (D) populations could be determined. (E) PTPMT1fl/fl/Mx1-Cre+ and PTPMT1+/+/Mx1-Cre+ mice (n = 5/group) were injected i.p. with BrdU (1.0 mg/6.0 g body weight) 4 weeks following pI-pC treatment. The mice were fed with BrdU (1.0 mg/ml) containing water for 10 days and sacrificed 100 days later. BM cells were isolated and assessed for percentages of BrdU+ cells in the HSC population as above. (F) LSK cells, HSCs, and various subsets of phenotypic MPPs were sorted from PTPMT1fl/fl/Mx1-Cre+ and PTPMT1+/+/Mx1-Cre+ mice (n = 3/group) 4 weeks following pI-pC treatment. mRNA levels of the indicated cell cycle regulatory genes in these cells were determined by quantitative RT-PCR. Data shown in all panels are presented as mean ± SD. Also see Figure S4.
Figure 6
Figure 6. Mitochondrial Aerobic Metabolism Is Defective in PTPMT1-Depleted LSK Cells
BM cells were freshly harvested from PTPMT1fl/fl/Mx1-Cre+ and PTPMT1+/+/Mx1-Cre+ mice (n = 4 or 5/group) 4 weeks following pI-pC treatment. HSCs were sorted. (A) Total DNA was extracted. Mitochondrial number was estimated by comparing mtDNA (Cytochrome B) levels to genomic DNA levels by quantitative PCR. (B) Total cellular ATP levels were determined using an ATP assay kit. (C) BM cells were immunostained with the antibodies recognizing HSC markers. Cells were then loaded with 2′-7′-dichlorofluorescein diacetate (DCF-DA) (5 μM) for 15 min. Mean fluorescence intensity in the gated HSC population was quantified by FACS to determine ROS (H2O2) levels. (D and E) LSK cells were sorted from PTPMT1fl/fl/Mx1-Cre+ and PTPMT1+/+/Mx1-Cre+ mice (n = 3 or 4/group) 4 weeks following pI-pC treatment. Oxygen consumption rates (OCR) (D) and extracellular acidification rates (ECAR) (E) of live LSK cells were measured in the presence of the mitochondrial inhibitor (oligomycin, 350 nM), the uncoupling agent (FCCP, 5 μM), and the respiratory chain inhibitor (rotenone, 1 μM). **p < 0.01. (F) Whole-cell lysates of sorted LSK cells were prepared and examined by immunoblotting with anti-phospho-AMPK, anti-phospho-ACC, and anti-UCP2 antibodies. Each lane represents an individual cell pool. Representative results from three independent experiments are shown. (G) BM cells freshly harvested from PTPMT1fl/fl/Mx1-Cre+ and PTPMT1+/+/Mx1-Cre+ mice (n = 5/group) 4 weeks following pI-pC treatment were immunostained with antibodies recognizing HSC markers. Cells were then fixed, permeablized using the BD Cytofix/Cytoperm kit (BD Biosciences), and immunostained with anti-phospho-AMPK (Thr172) antibody (Cell Signaling Technology). Mean fluorescence intensity in the gated HSC population was quantified and normalized by FACS to determine phospho-AMPK levels. Light and dark gray lines indicate isotype controls. Data shown in (A)–(E) and (G) are presented as mean ± SD. Also see Figure S5.
Figure 7
Figure 7. Excessive PIP Substrates of PTPMT1 Decrease Aerobic Metabolism by Enhancing UCP2 Activity
(A and B) PI(3,5)P2, PI5P, and PI(3,4)P2 (di-C16) (20 μM) were delivered (shuttled) into purified WT LSK cells using Shuttle PIP kits (Echelon Biosciences, Inc.). Cells were assessed for OCR. A representative figure is shown in (A) and statistical data are shown in (B). **p < 0.01. (C) Representative current-voltage characteristics of UCP2-containing membranes measured in the presence of PI(3,5)P2, arachidonic acid (AA), or both. Bilayer lipid membranes were made from E. coli polar lipid (1.8 mg/ml), AA (15 mol%), and hUCP2 (5 μg/mg lipid). Buffer solution contained 50 mM Na2S04, 10 mM TRIS, 10 mM MES, and 0.6 mM EGTA (pH = 7.35), T = 32°. (D) Comparison of membrane conductance in the absence or presence of PI(3,5)P2, PI5P, or PI(3,4)P2. All PIPs were added at 4 μM. Statistical data from three independent experiments are shown. (E) HSCs purified from PTPMT1fl/fl/Mx1-Cre+ mice 4 weeks after pI-pC treatment were cultured in SCF (50 ng/ml), IL-3 (25 ng/ml), and IL-6 (20 ng/ml) containing medium in the presence of PIKfyve inhibitor (YM201636) or DMSO (vehicle) for 7 days, immunostained for Mac-1 and B220, and then analyzed by FACS. Statistical data from three independent experiments are shown. (F) Sorted HSCs were assessed by the CFU assay in the presence of PIKfyve inhibitor (1 μM) or DMSO. Twelve days later, colonies derived were counted and genotyped individually. Data shown are mean ± SD of three independent experiments. Data shown in (A), (B), and (D)–(F) are presented as mean ± SD.

Comment in

  • Metabolic makeover for HSCs.
    Warr MR, Passegué E. Warr MR, et al. Cell Stem Cell. 2013 Jan 3;12(1):1-3. doi: 10.1016/j.stem.2012.12.005. Cell Stem Cell. 2013. PMID: 23290130
  • Stem cells: A metabolic switch.
    Baumann K. Baumann K. Nat Rev Mol Cell Biol. 2013 Feb;14(2):64-5. doi: 10.1038/nrm3515. Nat Rev Mol Cell Biol. 2013. PMID: 23340568 No abstract available.

References

    1. Balaban RS, Nemoto S, Finkel T. Mitochondria, oxidants, and aging. Cell. 2005;120:483–495. - PubMed
    1. Beck V, Jabůrek M, Breen EP, Porter RK, Jezek P, Pohl EE. A new automated technique for the reconstitution of hydrophobic proteins into planar bilayer membranes. Studies of human recombinant uncoupling protein 1. Biochim Biophys Acta. 2006;1757:474–479. - PubMed
    1. Beck V, Jabůrek M, Demina T, Rupprecht A, Porter RK, Jezek P, Pohl EE. Polyunsaturated fatty acids activate human uncoupling proteins 1 and 2 in planar lipid bilayers. FASEB J. 2007;21:1137–1144. - PubMed
    1. Bouillaud F. UCP2, not a physiologically relevant uncoupler but a glucose sparing switch impacting ROS production and glucose sensing. Biochim Biophys Acta. 2009;1787:377–383. - PubMed
    1. Brand MD, Esteves TC. Physiological functions of the mitochondrial uncoupling proteins UCP2 and UCP3. Cell Metab. 2005;2:85–93. - PubMed

Publication types