. 2013 Jan 3;12(1):75-87.
doi: 10.1016/j.stem.2012.09.015.

Fibronectin regulates Wnt7a signaling and satellite cell expansion

Affiliations

Fibronectin regulates Wnt7a signaling and satellite cell expansion

C Florian Bentzinger et al. Cell Stem Cell. .

Abstract

The influence of the extracellular matrix (ECM) within the stem cell niche remains poorly understood. We found that Syndecan-4 (Sdc4) and Frizzled-7 (Fzd7) form a coreceptor complex in satellite cells and that binding of the ECM glycoprotein Fibronectin (FN) to Sdc4 stimulates the ability of Wnt7a to induce the symmetric expansion of satellite stem cells. Newly activated satellite cells dynamically remodel their niche via transient high-level expression of FN. Knockdown of FN in prospectively isolated satellite cells severely impaired their ability to repopulate the satellite cell niche. Conversely, in vivo overexpression of FN with Wnt7a dramatically stimulated the expansion of satellite stem cells in regenerating muscle. Therefore, activating satellite cells remodel their niche through autologous expression of FN that provides feedback to stimulate Wnt7a signaling through the Fzd7/Sdc4 coreceptor complex. Thus, FN and Wnt7a together regulate the homeostatic levels of satellite stem cells and satellite myogenic cells during regenerative myogenesis.


Conflict of interest statement

The authors declare no conflict of interest.

Figures
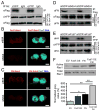
Figure 1
Figure 1. The FN receptor Sdc4 forms a functional complex with Fzd7
(A) Co-IP of Sdc4 with the Wnt7a receptor Fzd7 from satellite cell derived primary myoblasts overexpressing (OE) Fzd7-Flag and Sdc4-YFP. Co-IP was performed with an anti-YFP antibody or with an IgG control. (B) Proximity ligation assay (PLA) of Sdc4 and Fzd7 in activated satellite cells after 42 hours of fiber culture. No interaction is observed in siSdc4 treated cells. Scale bar = 5 μm. (C) Proximity ligation assay (PLA) of Sdc4 and FN in activated satellite cells after 42 hours of fiber culture. No interaction is observed in siSdc4 treated cells. Scale bar = 5 μm. (D) Co-IP of Fzd7 with FN from satellite cell derived primary myoblasts overexpressing (OE) Fzd7-Flag and FN. Co-IP was performed with an anti-YFP antibody. siRNA knockdown of endogenous Sdc4 (siSdc4) prevents Co-IP of FN with Fzd7 when compared to siSCR. (E) Co-IP of Sdc4 with Wnt7a from satellite cell derived primary myoblasts that overexpress (OE) Sdc4-YFP and Wnt7a-HA. Co-IP was performed with an anti-flag antibody. siRNA knockdown of endogenous Fzd7 prevents Co-IP of Sdc4 with Wnt7a. (F) Rac1 activation assay. Total Rac1 is shown as a loading control. Densitometric quantification represents average grey values ± SEM after subtraction of the background and normalization to total Rac1. The average grey value obtained for empty vector (EV) was set to 100%. n=3. p values are **p < 0.01; *p < 0.05.
Figure 2
Figure 2. The Fzd7/Sdc4 co-receptor complex drives the symmetric expansion of satellite stem cells
(A) Myofibers were isolated and cultured for 42h in the presence of Collagen (COL), FN, COL and Wnt7a (COL&Wnt7a) or FN and Wnt7a (FN&Wnt7a). FN potentiates the function of Wnt7a driving the expansion of satellite stem cells (Pax7+/YFP). Bars represent means ± SEM. n=4. p values are ***p < 0.001; *p < 0.05. (B) Quantification of satellite stem cell symmetric divisions after 42h of myofiber culture in the presence of COL, FN, COL&Wnt7a or FN&Wnt7a. Bars represent means ± SEM. n=4. p values are **p < 0.01; *p < 0.05. (C) Quantification of satellite cell populations after 72h of myofiber culture in the presence of COL, FN, COL&Wnt7a or FN&Wnt7a. Bars represent means ± SEM. n=3. p values are *p < 0.05. (D) FN&Wnt7a treatment results in the formation of clusters of satellite stem cells rather than mixed clusters by 72h of myofiber culture. Arrows indicate Pax7+/YFP satellite stem cells. Scale bar = 25 μm. (E and F) Antibodies to Sdc4 block the ability of Wnt7a to stimulate satellite stem cells (αSdc4&Wnt7a) when compared to IgG (IgG&Wnt7a) after 42h of myofiber culture. Inhibition of Sdc4 also decreased numbers of Pax7+/YFP+ cells. Bars represent means ± SEM. n=3. p value is **p < 0.01. (G) Quantification of satellite cell populations after 42h of myofiber culture in the presence of PBS vehicle, Tenascin-C (TEN), PBS&Wnt7a or TEN&Wnt7a. TEN inhibition of FN binding to Sdc4 antagonizes the effect of Wnt7a on satellite stem cells. Bars represent means ± SEM. n=3. p values is *p < 0.05.
Figure 3
Figure 3. Muscle regeneration is accompanied by a transient FN fibrosis
(A) In homeostatic muscle tissue, satellite cells are found in close proximity to FN rich areas resembling capillaries. Upon injury the muscle is highly saturated with FN and the satellite cells are deeply embedded within it. Arrows denote Pax7 expressing satellite cells. Scale bar = 50μm. (B) Regeneration time course after CTX injury of the TA muscle. FN levels increase at day 5 after CTX compared to the ECM component LM. Scale bar = 50 μm. (C) qPCR from whole muscle cDNA at the given time points after CTX injury. The expression of FN correlates with Pax7. Data points represent mean ± SEM. n=3. “no injury” was set to 100% for both genes. (D) FN expression in freshly FACS isolated cells from injured and uninjured muscle. Quiescent satellite cells (QSC) and activated satellite cells (ASC) are compared to non-satellite cells from uninjured (nSC-U) and injured (nSC-I) muscle. Bars represent means ± SEM. n=3. p value is *p < 0.05. (E) Microarray heat map representing ECM genes from quiescent satellite cells (Quie.), proliferating myoblasts (Prol.) and 2 or 5 day differentiated (2d diff./5d diff.) myofibers. The probe for FN (Fn1) shows the highest signal in proliferating myogenic cells and is substantially lower in Quie. and diff. (Asterisk). Signal intensities represent the average of n=3 microarrays per condition for Prol. and diff. and n=1 microarray for Quie.
Figure 4
Figure 4. Activated satellite cells express FN to remodel their niche
(A) Quiescent satellite cells which were directly fixed after fiber isolation, only express marginal amounts of FN, whereas proliferating activated satellite cells after 42h of fiber culture express high levels of FN. Scale bar = 5 μm. (B) After 72h of fiberculture the majority of Pax7 positive satellite cells stain strongly for FN. Scale bar = 50 μm. (C) 42h activated satellite cells that were stained with FN antibody before permeabilization (non perm.). Scale bar = 10 μm. (D) Activated satellite cells on fibers that were directly fixed after isolation from regenerating muscle five days after CTX injury express high levels of FN underneath the intact basal-lamina. Scale bar = 5 μm. (E) In dividing asymmetric satellite cell doublets on fibers after 42 hours of culture, satellite stem cells (Pax7+/YFP) contain lower levels of FN that the apical satellite myogenic cell (Pax7+/YFP+). Scale bar = 5 μm. (F) Background corrected, pooled average grey values of FN staining from >10 asymmetric divisions (as illustrated in Figure S3A). The area that was densitometrically analyzed for each cell in an individual division was kept constant. The YFP+ cell was set to 100% for each individual division.
Figure 5
Figure 5. Knock down of FN impairs satellite cell function
(A) FN was knocked down in satellite cells on isolated Myofibers in pFN free culture medium for 42h. siFN reduces the number of Pax7+/YFP+ cells per fiber when compared to the siSCR control. Bars represent means ± SEM. n=3. p values are is *p < 0.05. (B) siFN reduces the number of symmetric Pax7+/YFP+ divisions. Bars represent means ± SEM. n=3. p value is *p < 0.05. (C) Knockdown of FN severely reduces the number of Pax7+/YFP cells per fiber. Bars represent means ± SEM. n=3. p value is *p < 0.05. (D) No symmetric Pax7+/YFP division could be detected (n.d.= none detected) in the siFN condition when compared to siSCR. Bars represent means ± SEM. n=3.
Figure 6
Figure 6. Cell-autonomous FN is essential for the maintenance of satellite cells in their niche
(A) Scheme of the siRNA knockdown strategy that was used to test the function of cell-autonomous FN for satellite cells in vivo. (B) Three weeks after transplantation, donor derived cells are observed as zsGreen+/Pax7+ cells (yellow arrowheads) in host tissue. Scale bar = 50 μm. (C) Knockdown of FN in transplanted satellite cells resulted in a 65% reduction in their number. Only Pax7+/zsGreen+ donor cells were included in the quantification. Bars represent means ± SEM. n=3. p value is *p < 0.05. (D) The number of resident Pax7+/zsGreen satellite cells is not significantly changed by transplantation of siFN or siSCR treated satellite cells. Bars represent means ± SEM. n=3.
Figure 7
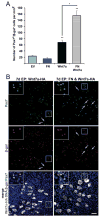
Figure 7. Wnt7a and FN stimulate the expansion of satellite stem cells in muscle tissue
(A) Plasmid vectors expressing FN and Wnt7a were electroporated into TA muscles of Myf5-LacZ mice. After 7d the electro-damage induced regeneration is accompanied by an increase in the amount of Pax7+/β-gal satellite stem cells for Wnt7a and for Wnt7a&FN when compared to empty vector (EV). A significant increase in Pax7+/β-gal satellite stem cell numbers can be observed for FN&Wnt7a when compared to Wnt7a alone. Bars represent means ± SEM. n=3. p values are ***p < 0.001; **p < 0.01; *p < 0.05. (B) At seven days following electroporation, the effect of FN and Wnt7a is readily apparent. Arrows indicate Pax7+/β-gal satellite stem cells. Scale bar = 50μm.

Comment in

References

    1. Adi S, Bin-Abbas B, Wu NY, Rosenthal SM. Early stimulation and late inhibition of extracellular signal-regulated kinase 1/2 phosphorylation by IGF-I: a potential mechanism mediating the switch in IGF-I action on skeletal muscle cell differentiation. Endocrinology. 2002;143:511–516. - PubMed
    1. Allen RE, Boxhorn LK. Regulation of skeletal muscle satellite cell proliferation and differentiation by transforming growth factor-beta, insulin-like growth factor I, and fibroblast growth factor. Journal of cellular physiology. 1989;138:311–315. - PubMed
    1. Ates K, Yang SY, Orrell RW, Sinanan AC, Simons P, Solomon A, Beech S, Goldspink G, Lewis MP. The IGF-I splice variant MGF increases progenitor cells in ALS, dystrophic, and normal muscle. FEBS letters. 2007;581:2727–2732. - PubMed
    1. Bass MD, Roach KA, Morgan MR, Mostafavi-Pour Z, Schoen T, Muramatsu T, Mayer U, Ballestrem C, Spatz JP, Humphries MJ. Syndecan-4-dependent Rac1 regulation determines directional migration in response to the extracellular matrix. The Journal of cell biology. 2007;177:527–538. - PMC - PubMed
    1. Beauvais DM, Rapraeger AC. Syndecans in tumor cell adhesion and signaling. Reprod Biol Endocrinol. 2004;2:3. - PMC - PubMed

Publication types