. 2013 Jun;7(3):440-51.
doi: 10.1016/j.molonc.2012.12.003. Epub 2012 Dec 19.

Targeting HER2-positive cancer cells with receptor-redirected anthrax protective antigen

Affiliations

Targeting HER2-positive cancer cells with receptor-redirected anthrax protective antigen

Andrew J McCluskey et al. Mol Oncol. 2013 Jun.

Abstract

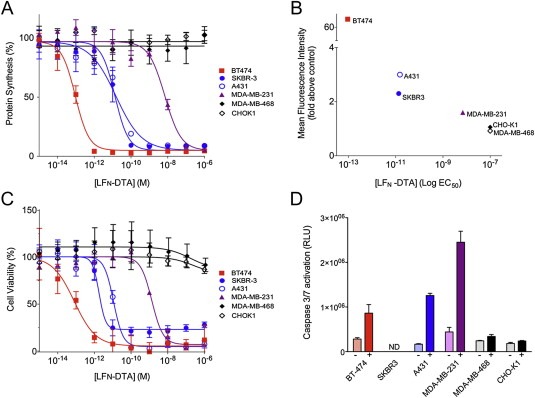
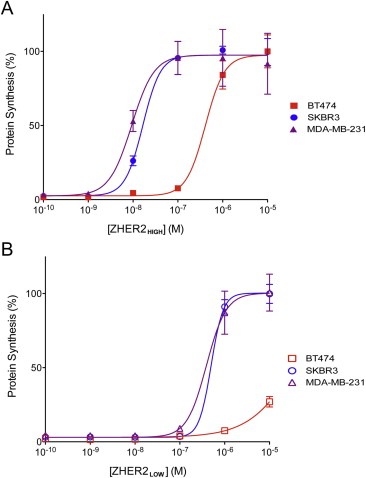
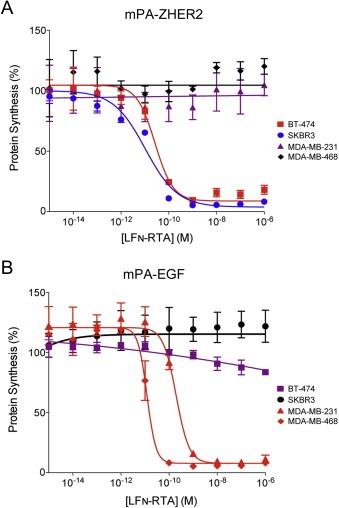
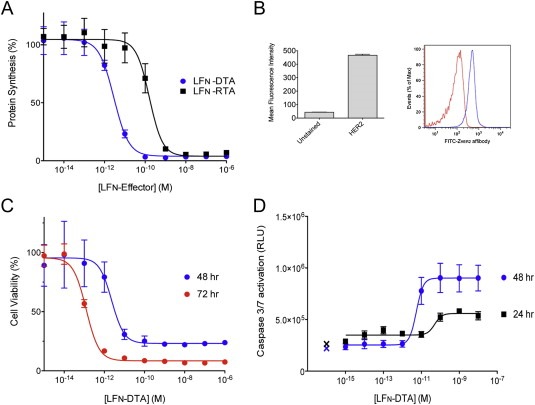
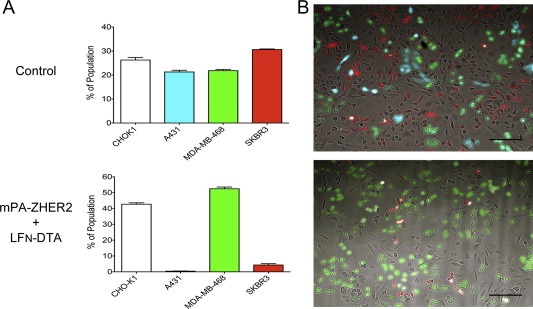
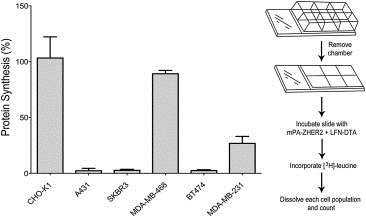
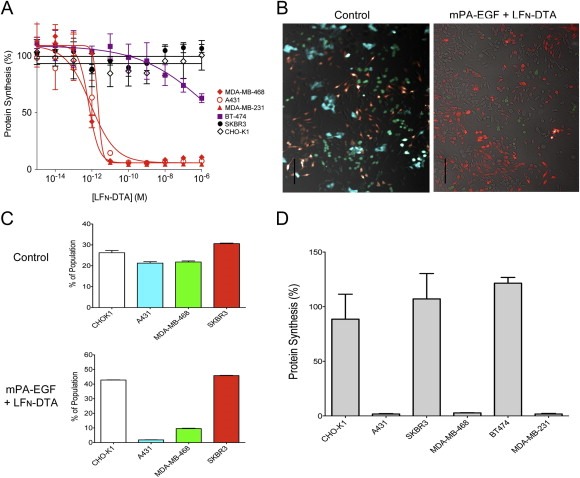
Targeted therapeutics have emerged in recent years as an attractive approach to treating various types of cancer. One approach is to modify a cytocidal protein toxin to direct its action to a specific population of cancer cells. We created a targeted toxin in which the receptor-binding and pore-forming moiety of anthrax toxin, termed Protective Antigen (PA), was modified to redirect its receptor specificity to HER2, a marker expressed at the surface of a significant fraction of breast and ovarian tumors. The resulting fusion protein (mPA-ZHER2) delivered cytocidal effectors specifically into HER2-positive tumor cells, including a trastuzumab-resistant line, causing death of the cells. No off-target killing of HER2-negative cells was observed, either with homogeneous populations or with mixtures of HER2-positive and HER2-negative cells. A mixture of mPA variants targeting different receptors mediated killing of cells bearing either receptor, without affecting cells devoid of these receptors. Anthrax toxin may serve as an effective platform for developing therapeutics to ablate cells bearing HER2 or other tumor-specific cell-surface markers.


Figures

Figure 1
Figure 1
HER2‐dependent killing of cell lines by mPA‐ZHER2 plus LFN‐DTA. (A) Cells were incubated with a fixed concentration of mPA‐ZHER2 (20 nM) plus various concentrations of LFN‐DTA for 4 h and then with medium containing [3H]‐leucine for 1 h. Protein synthesis was measured by scintillation counting and normalized against cells treated with mPA‐ZHER2 alone. (B) HER2 receptor levels were determined by flow cytometry with an FITC‐labeled anti‐HER2 Affibody. Mean fluorescence intensity was calculated using the FloJo software package and plotted versus the logEC50 for [LFN‐DTA]. (C) Cells were exposed to the same conditions as panel A. After 48 h, cell viability was measured by XTT cytotoxicity assay and normalized against cells treated with mPA‐ZHER2 alone. (D) Apoptosis was assessed after exposing cells to either mPA‐ZHER2 alone (−; light bars) or mPA‐ZHER2 plus 10 nM LFN‐DTA (+; dark bars) for 24 h and measuring caspase 3/7 activation. Values corresponding to relative light units (RLU), generated by caspase 3/7 cleavage of a pre‐luminescent substrate, were extracted from dose—response curves presented in SFigure 2 (ND = not determined). In all panels, cell lines with high, moderate, low, and no detectable HER2 receptor levels are colored red, blue, purple, and black, respectively. Each point on the graphs represents the average of four experiments.
Figure 2
Figure 2
Competition by high‐ and low‐affinity ZHER2 Affibodies for mPA‐ZHER2‐dependent killing. Cells were exposed to a lethal dose of mPA‐ZHER2 and LFN‐DTA in the presence of increasing amounts of a high (ZHER2:342, panel A) or lower (ZHER2:4, panel B) affinity HER2 Affibody for 4 h, and the incorporation of [3H]‐leucine was measured and graphed as described in Figure 1. High, moderate, and low HER2 expressing cell lines are shown in red, blue, and purple, respectively. Each point on the curves represents the average of four experiments.
Figure 3
Figure 3
mPA‐ZHER2‐ and mPA‐EGF‐directed killing of cell lines by LFN‐RTA. Cells were exposed to mPA‐ZHER2 (Panel A) or mPA‐EGF (Panel B) in combination with LFN‐RTA, at the indicated concentrations for 4 h, and the level of protein synthesis was measured by scintillation counting. Cells expressing high, moderate, low, or no detectable levels of HER2 or EGFR are colored red, blue, purple, and black, respectively.
Figure 4
Figure 4
Killing of a HER2‐positive, trastuzumab‐resistant tumor cell line by mPA‐ZHER2 plus LFN‐DTA or LFN‐RTA. (A) The JIMT‐1 tumor cell line was incubated with mPA‐ZHER2 in combination with increasing amounts of LFN‐DTA (blue) or LFN‐RTA (black) for 4 h, and the effects on [3H]‐leucine incorporation were measured as described in Figure 1. (B) FACS analysis using an FITC‐conjugated HER2 Affibody confirms the expression of HER2 on the surface of JIMT‐1 cells. The mean fluorescence was calculated using the FlowJo software package and plotted in the GraphPad Prism® software package (left panel) from the raw data presented in the histogram (right panel), which displays the shift in fluorescence (blue) compared to unstained cells (red). (C) JIMT‐1 cells were exposed to the same conditions as panel A. After 48 or 72 h, cell viability was measured by XTT assay and plotted as percent cell viability normalized against control cells treated with mPA‐ZHER2 alone. (D) Caspase 3/7 activation, an indicator of apoptosis, was measured after a 24 and 48 h exposure to 20 nM mPA‐ZHER2 and LFN‐DTA, at the indicated concentrations. The cleavage of a pre‐luminescent caspase 3/7 substrate generated RLU's that are plotted versus LFN‐DTA concentration. Control cells treated with mPA‐ZHER2 alone are indicated with an X.
Figure 5
Figure 5
mPA‐ZHER2 mediates specific killing of HER2‐positive cells in a heterogeneous population. Fluorescent cells shown to be sensitive to the actions of mPA‐ZHER2 and LFN‐DTA (A431CFP and SKBR3RFP) were mixed equally with resistant cells (CHO‐K1 and MDA‐MB‐468GFP) and incubated with mPA‐ZHER2 plus LFN‐DTA or with mPA plus LFN‐DTA (control; the control FACS data are identical to those in Figures 7C and 8A, as all of the experiments were conducted simultaneously). After 24 h, cells were detached with trypsin and quantified by FACS (Panel A) or washed with PBS and imaged with a fluorescence microscope (Panel B; scale bar is 100 µm). Each bar represents the average of experiments performed in triplicate.
Figure 6
Figure 6
mPA‐ZHER2‐mediated killing in a heterogeneous cell population. Tumor cells were plated in separate compartments of a chambered slide (right panel) and incubated at 37 °C. The following day, the chambers were removed, and the slide was incubated with mPA‐ZHER2 plus LFN‐DTA. After 4 h, cells were incubated with medium supplemented with [3H]‐leucine for 1 h and dissolved in 6 M Guanidine–HCl, and the incorporated radiolabel was quantified by scintillation counting. Percent protein synthesis was normalized against cells treated with mPA + LFN‐DTA.
Figure 7
Figure 7
mPA‐EGF specifically kills EGF‐expressing cells in a heterogeneous population. (A) Cells were exposed to 20 nM mPA‐EGF and LFN‐DTA at the concentrations indicated for 4 h and protein synthesis was measured as in experiments described above. Percent protein synthesis was normalized against cells treated with mPA‐EGF alone. Cell lines expressing high, low, and no detectable amounts of EGFR are colored red, purple, and black respectively. Each point on the curves represents the average of four experiments. (B and C) Populations of fluorescent cells were mixed and exposed to a lethal dose of mPA‐EGF and LFN‐DTA or mPA + LFN‐DTA as a control; the control FACS data are identical to those in Figures 5A and 8A, as all of the experiments were conducted simultaneously. After 24 h, cells were washed with PBS and imaged with a fluorescence microscope (B; scale bar is 100 µm) or detached with trypsin and quantified by FACS (C). Each bar represents the average of experiments performed in triplicate. (D) A panel of cancer cell lines was plated in chambered slides overnight. The following day the chambers were removed and cells were exposed to the same treatments as described in panels B and C. Following intoxication for 4 h, cells were processed, and protein synthesis was quantified as described in panel A.
Figure 8
Figure 8
Redirected mPA variants act together to eliminate heterogeneous tumor cell populations. (A and B) Various fluorescent cells were mixed in equal numbers and exposed to LFN‐DTA plus an equimolar mixture of mPA‐ZHER2 and mPA‐EGF. LFN‐DTA plus mPA was used as control (the control FACS data are identical to those in Figures 5A and 7C, as all of the experiments were conducted simultaneously). After 24 h, cell populations were detached with trypsin and quantified by FACS (A) or washed with PBS and imaged with a fluorescence microscope (B; scale bar is 100 µm). Each bar represents the average of experiments performed in triplicate using SKBR3 (red), A431 (cyan), MDA‐MB‐468 (green), and CHO‐K1 (unlabeled) cells. (C) A larger panel of cancer cell lines were plated in separate compartments of a chambered slide overnight. The following day, the partition was removed and cells were exposed to the same treatments as described above. Following intoxication for 4‐h, cells were incubated with medium supplemented with [3H]‐leucine for 1‐h, and protein synthesis was quantified by scintillation counting. Percent protein synthesis was normalized against cells treated with mPA and LFN‐DTA.

Similar articles

Cited by

References

    1. Abi-Habib, R.J. , 2006. A urokinase-activated recombinant anthrax toxin is selectively cytotoxic to many human tumor cell types. Molecular Cancer Therapeutics 5, (10) 2556–2562. - PubMed
    1. Arteaga, C.L. , 2012. Treatment of HER2-positive breast cancer: current status and future perspectives. Nature Reviews Clinical Oncology 9, (1) 16–32. - PubMed
    1. Berchuck, A. , 1990. Overexpression of HER-2/neu is associated with poor survival in advanced epithelial ovarian cancer. Cancer Research 50, (13) 4087–4091. - PubMed
    1. Bradley, K.A. , 2001. Identification of the cellular receptor for anthrax toxin. Nature 414, (6860) 225–229. - PubMed
    1. Carter, P.J. , Senter, P.D. , 2008. Antibody-drug conjugates for cancer therapy. Cancer Journal (Sudbury, Mass.) 14, (3) 154–169. - PubMed

Publication types

MeSH terms