Review
. 2013 Sep 1;74(5):340-7.
doi: 10.1016/j.biopsych.2012.11.028. Epub 2013 Jan 4.

Resting state functional connectivity in preclinical Alzheimer's disease

Affiliations
Review

Resting state functional connectivity in preclinical Alzheimer's disease

Yvette I Sheline et al. Biol Psychiatry. .

Abstract

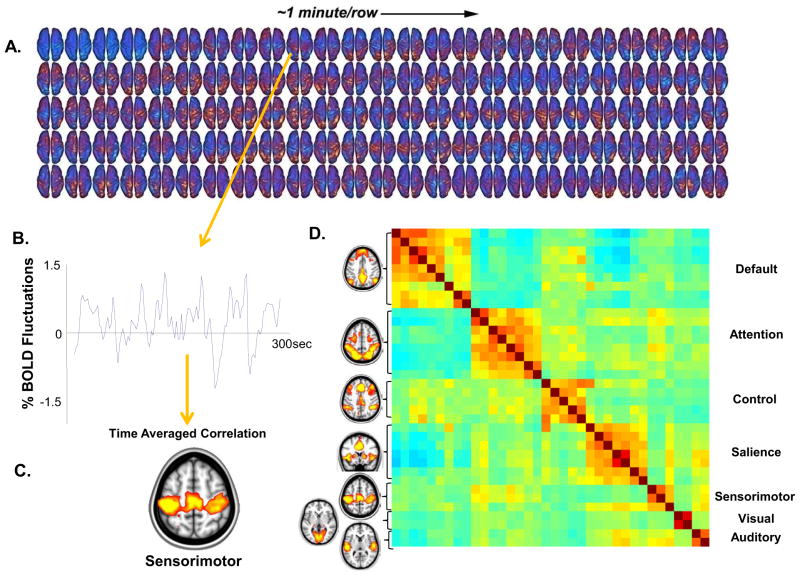
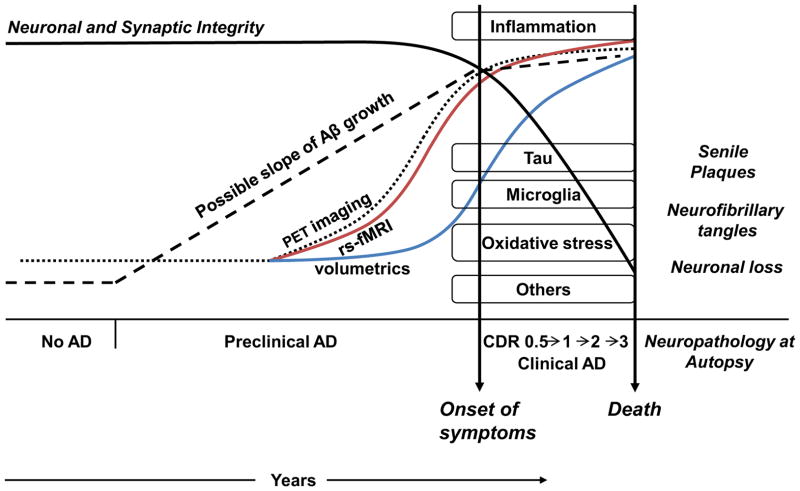
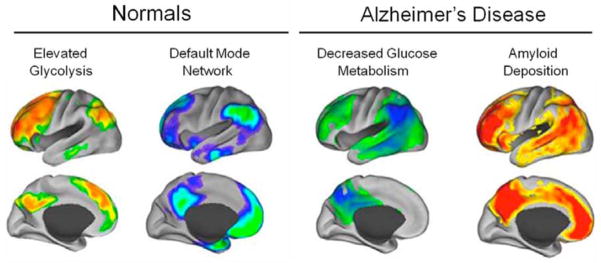
There has been a dramatic increase in the number of studies using resting state functional magnetic resonance imaging (rs-fMRI), a recent addition to imaging analysis techniques. The technique analyzes ongoing low-frequency fluctuations in the blood oxygen level-dependent signal. Through patterns of spatial coherence, these fluctuations can be used to identify the networks within the brain. Multiple brain networks are present simultaneously, and the relationships within and between networks are in constant dynamic flux. Resting state fMRI functional connectivity analysis is increasingly used to detect subtle brain network differences and, in the case of pathophysiology, subtle abnormalities in illnesses such as Alzheimer's disease (AD). The sequence of events leading up to dementia has been hypothesized to begin many years or decades before any clinical symptoms occur. Here we review the findings across rs-fMRI studies in the spectrum of preclinical AD to clinical AD. In addition, we discuss evidence for underlying preclinical AD mechanisms, including an important relationship between resting state functional connectivity and brain metabolism and how this results in a distinctive pattern of amyloid plaque deposition in default mode network regions.

Keywords: Amyloid; BOLD; default mode network (DMN); fMRI; glycolysis; precuneus.


Figures

Figure 1
Figure 1
From the fluctuating patterns of intrinsic activity seen in the human brain with fMRI BOLD imaging striking patterns of spatial coherence within known brain systems can be extracted. A single subject example of data from which these patterns are derived is shown (A). These data were obtained continuously over a period of 5 minutes (each row is one minute, each frame is 2.3 seconds). An interpolated version of these data in a movie format may be downloaded from (ftp://imaging.wustl.edu/pub/raichlab/restless_brain). Patterns of spatial coherence are obtained by placing a seed region in a single focus within a system (in this case in the sensorimotor cortex) and extracting the resulting BOLD time series (B). This time series is then used to search the brain for correlated time series. The results are brain-network specific images of spatial coherence in the ongoing activity of the brain (C). This strategy has been applied with ever increasing sophistication to systems throughout the human brain. A more complete description of the data processing steps leading to such images is presented elsewhere along with alternate strategies (94). Shown in (D) are 7 major brain networks analyzed in this way accompanied by a. cross-correlogram constructed from regions of interest within the 7 brain networks shown. The data represent a 30 minute average from a normal adult male volunteer resting quietly in 3T scanner (Siemens Trio) but awake. The names of the regions are shown along the right. The diagonal of the correlogram represents the correlation of each region with itself. It should be noted that while correlations within networks appear distinctive in this presentation, relationships among networks (both positive and negative) are also prominent emphasizing the integrated nature of the brain’s functional networks. An additional important feature of the data presented in this cross-correlogram is its temporal dynamics. While not feasible to present in the form of static images these temporal dynamics in movie format may be downloaded from (ftp://imaging.wustl.edu/pub/raichlab/restless_brain).
Figure 2
Figure 2. Timecourse from Preclinical to Clinical AD: Pathophysiology and Imaging
Preclinical AD has been hypothesized to begin many years or decades before clinical symptoms. Progressive amyloid accumulation occurs early, with models for the kinetics of amyloid accumulation shown with different dotted lines. As yet the kinetics remain to be determined. Tau deposition, augmented by oxidative damage and inflammation, results in neuronal death. In the figure the timing and onset of tau deposition, inflammation, activated microglia, oxidative stress and other mechanisms is not meant to be precise but is simply meant to show onset during the preclinical phase. Following onset of cognitive decline clinical progression occurs resulting inevitably in death. The definitive diagnosis of AD can only be made post-mortem with autopsy showing neuropathological features of senile plaques and neurofibrillary tangles. Amyloid accumulation is imaged with positron emission tomography (PET) scanning (dotted curve). Kinetic models for amyloid deposition remain to be determined. Following PET detection of amyloid and before structural damage, abnormalities in resting state functional connectivity can be detected on fMRI (red curve) (see text for exceptions). Progressive neurotoxicity manifests cumulatively as structural damage in imaging studies (blue curve). Following structural damage, cognitive decline produces progressive clinical deterioration.
Figure 3
Figure 3. Similarity in Regions of Connectivity Loss in Early AD and Cognitively Normal Elderly with Increased Brain Amyloid Binding
Figure 3A and 3B: Resting state functional connectivity is significantly decreased in early Alzheimers disease. Using the precuneus as the seed region there is less functional connectivity with the left hippocampus (L Hip), left parahippocampus (L Parahip), anterior cingulate cortex (AC) and gyrus rectus (GR) and increased connectivity with visual cortex (VC). Figure 3C and 3D: Again using the precuneus as the seed region, the same pattern of rs-fMRI abnormalities was found in cognitively normal persons with elevated amyloid binding on PIB-PET. The regions with decreased functional connectivity are shown in blue and those with increased connectivity are shown in red. Adapted from Sheline et al (68).
Figure 4
Figure 4. Default Mode Network Regions Have Elevated Glycolysis in Normals and Decreased Glucose Metabolism and Amyloid Binding in AD
4a) Default mode network (DMN) regions have increased aerobic glycolysis; 4b) DMN regions in the normal brain; 4c) DMN regions have decreased glucose metabolism in AD; 4d) DMN regions are the first to develop amyloid deposition in AD.

Comment in

References

    1. Christoff K, Gordon AM, Smallwood J, Smith R, Schooler JW. Experience sampling during fMRI reveals default network and executive system contributions to mind wandering. Proc Natl Acad Sci U S A. 2009;106:8719–8724. - PMC - PubMed
    1. Mason MF, Norton MI, Van Horn JD, Wegner DM, Grafton ST, Macrae CN. Wandering minds: the default network and stimulus-independent thought. Science. 2007;315:393–395. - PMC - PubMed
    1. Gruberger M, Ben-Simon E, Levkovitz Y, Zangen A, Hendler T. Towards a neuroscience of mind-wandering. Front Hum Neurosci. 2011;5:56. - PMC - PubMed
    1. Hasenkamp W, Wilson-Mendenhall CD, Duncan E, Barsalou LW. Mind wandering and attention during focused meditation: a fine-grained temporal analysis of fluctuating cognitive states. Neuroimage. 2012;59:750–760. - PubMed
    1. Morcom AM, Fletcher PC. Does the brain have a baseline? Why we should be resisting a rest. Neuroimage. 2007;37:1073–1082. - PubMed

Publication types

MeSH terms