Review
. 2013 Apr:229:173-86.
doi: 10.1016/j.jmr.2012.11.014. Epub 2012 Dec 8.

Perspectives of hyperpolarized noble gas MRI beyond 3He

Affiliations
Review

Perspectives of hyperpolarized noble gas MRI beyond 3He

David M L Lilburn et al. J Magn Reson. 2013 Apr.

Abstract

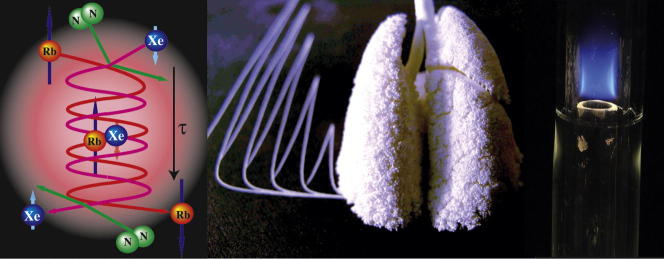
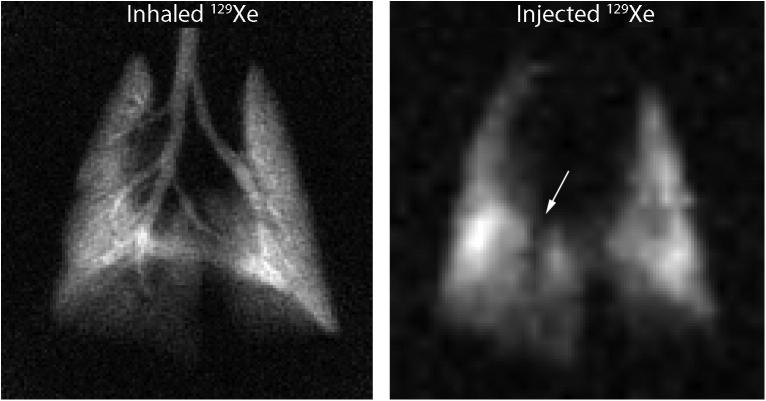
Nuclear Magnetic Resonance (NMR) studies with hyperpolarized (hp) noble gases are at an exciting interface between physics, chemistry, materials science and biomedical sciences. This paper intends to provide a brief overview and outlook of magnetic resonance imaging (MRI) with hp noble gases other than hp (3)He. A particular focus are the many intriguing experiments with (129)Xe, some of which have already matured to useful MRI protocols, while others display high potential for future MRI applications. Quite naturally for MRI applications the major usage so far has been for biomedical research but perspectives for engineering and materials science studies are also provided. In addition, the prospects for surface sensitive contrast with hp (83)Kr MRI is discussed.


Figures

None
Graphical abstract
Fig. 1
Fig. 1
Evolution of hp 129Xe image resolution over a decade. (A) Early image of a rat lung from 1998 with in-plane resolution 0.84 × 0.84 mm2 and SNR of ∼3. (B–D) Progressively better image quality as polarization, gas delivery and MR acquisition techniques continue to improve. (D) Image from 2007 with resolution 0.31 × 0.31 mm2 and an SNR of ∼20. Reprinted with permission from Driehuys et al. Toxicol. Pathol. 2007; 35:55. © SAGE Publications.
Fig. 2
Fig. 2
Hp 129Xe slice selective coronal MR images (in red) overlayed onto corresponding proton thoracic images from healthy volunteers and subjects with asthma, chronic obstructive pulmonary disease (COPD), cystic fibrosis (CF) and radiation-induced lung injury (RILI). Reprinted with permission from Shukla et al. Acad. Radiol., 2012; 19:944, © 2012 Elsevier. (For interpretation of the references to color in this figure legend, the reader is referred to the web version of this article.)
Fig. 3
Fig. 3
Comparison of signal amplitude between two trains of 127 pulses using constant flip angle (FLASH) of 12° (a) and variable flip angle (VFA) (b) methods. Experimental data are represented by the dots, while the solid lines represent theoretical predictions. Reprinted with permission from Zhao et al. J. Magn. Reson. Ser. B, 1996; 113:180. © 1996 Elsevier.
Fig. 4
Fig. 4
Joint spatial–velocity images of xenon Poiseuille flow in a pipe (id = 4 mm, ΔXe = 4.5 mm2/s, Vave = 20 mm/s). The x-axis represents axial velocity (i.e. in z-direction) while the y-axis represents spatial location across the pipe with 0 mm referring to the pipe center. The spectral window in the flow-encoding dimension was kept constant. (A) Computer simulation with Δ = 10 ms. (B) Experiment with Δ = 10 ms. (C) Experiment with Δ = 60 ms. (D) Experiment with Δ = 130 ms. Adapted figure, printed with permission from Kaiser et al. J. Magn. Reson. 2001; 149:145. © 2001 Elsevier.
Fig. 5
Fig. 5
(a) NMR spectrum of hyperpolarized 129Xe from a sample that contains gas phase xenon (close to 0 ppm depending on pressure) and xenon occluded within aerogel fragments (around 25 ppm). (b) 2-D slice of 3-D chemical shift selective MRI of the bulk gas phase (0 ppm) surrounding the aerogel fragments. (c–e) 2-D slice of 3-D chemical shift selective MRI using the 25 ppm signal with rising recycle delay times τ that lead to an increasing penetration of the hp 129Xe into the material. High signal intensity indicates a high concentration of hp 129Xe within the aerogel fragments. Inspection of (c–e) reveals that the penetration into the aerogel fragments is strongly anisotropic due to reduced flow between the particles. Adapted figure, printed with permission from Kaiser et al. P. Ntl. Acad. Sci. USA. 2000; 97:2415-6. © 2000 National Academy of Sciences, USA.
Fig. 6
Fig. 6
One of the earliest hp 129Xe spectra and washout dynamics from the rat pulmonary system. (a) Hp 129Xe spectra at t = 0 after inhalation of the last xenon bolus. Peak A, B and C at 191, 199, 213 ppm relative to the gas phase peak at 0 ppm attributed to the blood plasma, lung tissue and red blood cells respectively. (b) Temporal dynamics on hp 129Xe washout with the combined effects of ventilation, RF depletion and longitudinal relaxation. Reprinted with permission from Sakai et al. J. Magn. Reson. Ser. B, 1996; 111:301. © 1996 Elsevier.
Fig. 7
Fig. 7
Inhaled hp 129Xe images from saline treated rat (sham) and bleomycin treated rat (fibrosis model). Images (A–C) from sham instillation of saline into the left lung. (A) Gas phase 129Xe image from the airspaces. (B) Tissue phase 129Xe image from the lung parenchyma. (C) Red blood cell (RBC) phase 129Xe image. (D–F) Comparable images 11 days after bleomycin instillation into the left lung with D, E and F representing the gas phase, tissue phase and RBC phase images respectively. Note that the tissue images closely match the gas phase images in both rats whilst the RBC phase images show almost absent uptake of 129Xe by the RBCs in the bleomycin treated lung in the time-frame of the MRI experiment as compared to the sham treated rat, indicating thickening of the alveolar membrane (fibrosis). Reprinted with permission from Driehuys et al. P. Ntl. Acad. Sci. USA, 2006; 103:18280. © 2006 National Academy of Sciences, USA.
Fig. 8
Fig. 8
Gas phase image from rat lung with directly inhaled hp 129Xe and delivered by injection of hp 129Xe in saline solution. The injected image shows a signal void corresponding to the right main stem bronchus (arrow). Reprinted with permission from Driehuys et al. Radiology, 2009; 252:390. © 2009 Radiological Society of North America.
Fig. 9
Fig. 9
(a) Proton apparent diffusion coefficient (ADC) map image post right middle cerebral artery occlusion. Ischemic core (absent perfusion) is indicated by ADC values <5.30 × 010−4 mm2/s (circled by blue line). (b) Corresponding hp 129Xe chemical shift image displayed in arbitrary units with the greatest signal originating from healthy brain tissue and an obvious signal void corresponding to the ischemic core. (c) 2,3,5-triphenyltetrazolium chloride (TTC)-stained brain section of the same animal. (d) Tricolor map based on the ADC and TTC images shown in (a) and (c) with healthy brain tissue (green), ischemic core (red) and penumbra (blue). Reprinted with permission from Zhou et al. Nmr Biomed. 2011; 24:173. © 2011 John Wiley and Sons, Inc. (For interpretation of the references to color in this figure legend, the reader is referred to the web version of this article.)
Fig. 10
Fig. 10
Hp 129Xe biosensor approach. (a) Cryptophane-A cage, acting as a xenon encapsulating agent, tethered to a bioactive ligand (red) with a specific binding affinity for avidin. (b) Full spectrum (bottom): actual hp 129Xe spectrum of the biosensor in the absence of avidin. The signal at 193 ppm is from xenon in solution (i.e. water) while the signal at 70 ppm corresponds to xenon in the cryptophane-A cage of the biosensor molecule shown in (see inset i). The signal at 71 ppm originates from xenon in cryptophane-A cages without tether. When avidin is added, another signal appears (ii) just below 73 ppm. Adapted figure, printed with permission from Spence et al. P. Ntl. Acad. Sci. USA, 2001; 98:10655. © 2001 National Academy of Sciences, USA. (For interpretation of the references to color in this figure legend, the reader is referred to the web version of this article.)
Fig. 11
Fig. 11
Remotely detected images of gas flow through the rock sample for various arrival times (i.e. time between encoding and detection) as indicated above each image. As the fluid flows through a sample, the nuclear spin magnetization is modulated by RF pulses and magnetic field gradients to encode its spatial coordinates. After leaving the sample, the 129Xe magnetization is recorded when it arrives at the detection coil. (a) 3D representation, (b) time of flight x–z images with varying detection times after encoding. Reprinted figure with permission from Granwehr et al. Phys. Rev. Lett., 2005; 95:075503-3. © 2005 American Physical Society.
Fig. 12
Fig. 12
(A) Photograph of a sample containing 1.0 mm glass beads with a siliconized, hydrophobic surface in compartment (i) and an untreated, hydrophilic surface in compartment (ii). (B) MRI of gas phase hp 83Kr shortly after transfer into the sample. (C) Hp 83Kr MRI as in (B) but after additional 6 s delay time, showing a surface sensitive MRI contrast. The 83Kr quadrupolar relaxation caused by surface interactions leads to T1 = 9 s in the hydrophobic region (i) and to T1 = 35 s in the hydrophilic region (ii). Adapted figure, printed with permission from Pavlovskaya et al. P. Ntl. Acad. Sci. USA 2005; 102:18278 © 2005 National Academy of Sciences, USA.

References

    1. Kuethe D.O., Caprihan A., Gach H.M., Lowe I.J., Fukushima E. Imaging obstructed ventilation with NMR using inert fluorinated gases. J. Appl. Physiol. 2000;88:2279–2286. - PubMed
    1. Anger B.C., Schrank G., Schoeck A., Butler K.A., Solum M.S., Pugmire R.J., Saam B. Gas-phase spin relaxation of Xe-129. Phys. Rev. A. 2008;78:043406.
    1. Jacob R.E., Morgan S.W., Saam B., Leawoods J.C. Wall relaxation of He-3 in spin-exchange cells. Phys. Rev. Lett. 2001;87 - PubMed
    1. Cleveland Z.I., Meersmann T. Density-independent contributions to longitudinal relaxation in Kr-83. ChemPhysChem. 2008;9:1375–1379. - PubMed
    1. Cleveland Z.I., Meersmann T. Binary-collision-induced longitudinal relaxation in gas-phase Kr-83. J. Chem. Phys. 2008;129:244304. - PubMed