. 2013 Feb 7;49(3):453-63.
doi: 10.1016/j.molcel.2012.12.001. Epub 2013 Jan 3.

Cotranslational response to proteotoxic stress by elongation pausing of ribosomes

Affiliations

Cotranslational response to proteotoxic stress by elongation pausing of ribosomes

Botao Liu et al. Mol Cell. .

Abstract

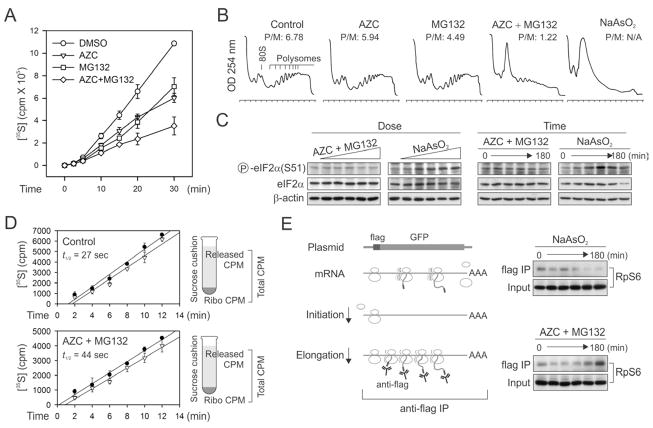
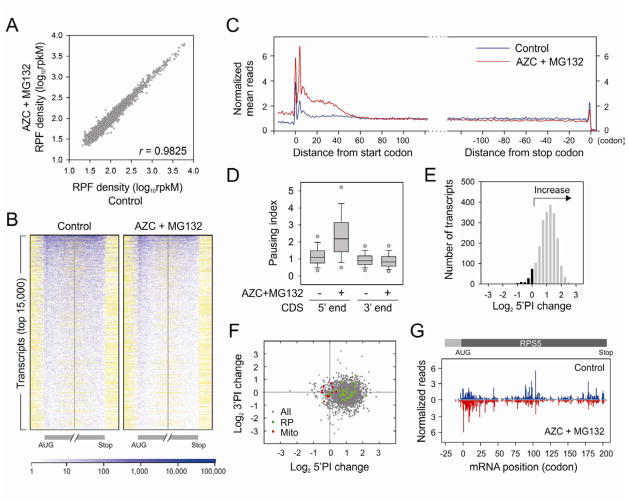
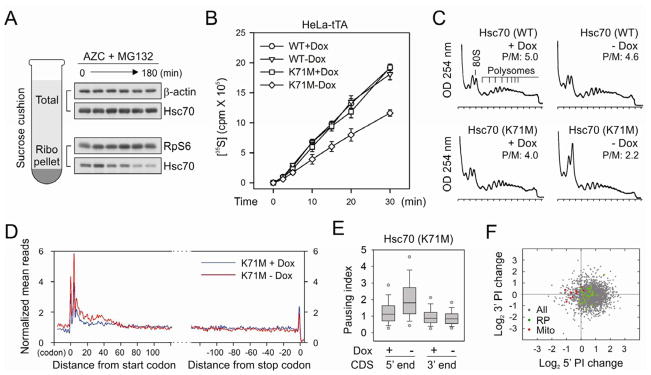
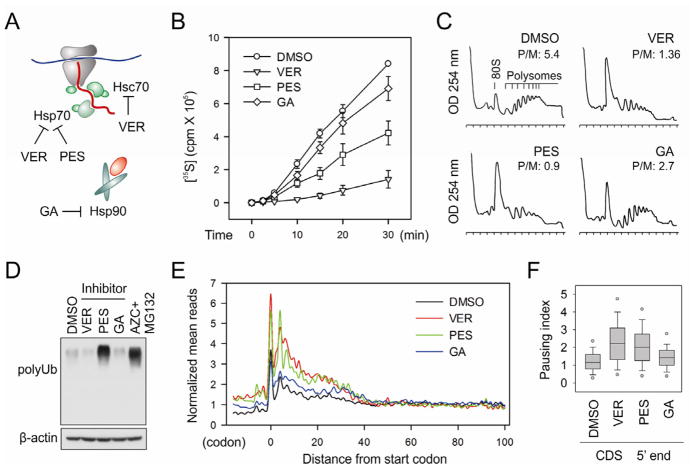
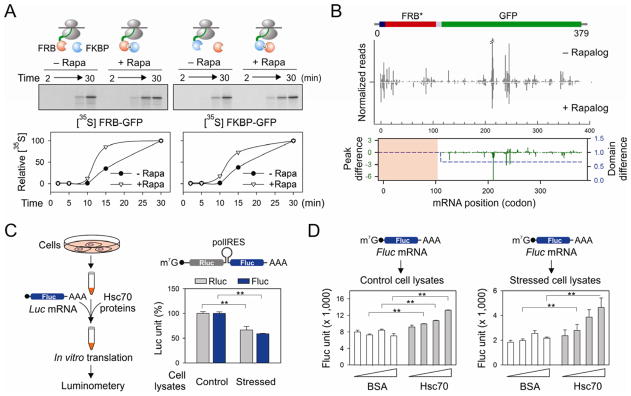
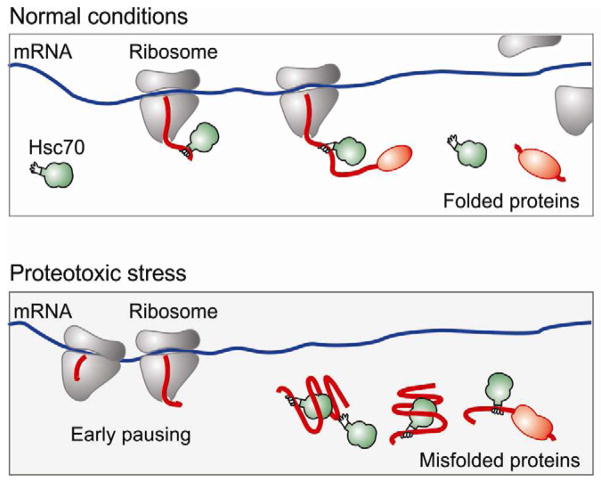
Translational control permits cells to respond swiftly to a changing environment. Rapid attenuation of global protein synthesis under stress conditions has been largely ascribed to the inhibition of translation initiation. Here we report that intracellular proteotoxic stress reduces global protein synthesis by halting ribosomes on transcripts during elongation. Deep sequencing of ribosome-protected messenger RNA (mRNA) fragments reveals an early elongation pausing, roughly at the site where nascent polypeptide chains emerge from the ribosomal exit tunnel. Inhibiting endogenous chaperone molecules by a dominant-negative mutant or chemical inhibitors recapitulates the early elongation pausing, suggesting a dual role of molecular chaperones in facilitating polypeptide elongation and cotranslational folding. Our results further support the chaperone "trapping" mechanism in promoting the passage of nascent chains. Our study reveals that translating ribosomes fine tune the elongation rate by sensing the intracellular folding environment. The early elongation pausing represents a cotranslational stress response to maintain the intracellular protein homeostasis.


Figures

Figure 1
Figure 1. Proteotoxic stress attenuates protein synthesis by affecting translation elongation
(A)Global protein synthesis in HEK293 cells treated with either 10 mM AZC, or 20 μM MG132, or both. [35S] radioactivity of trichloroacetic acid (TCA)-insoluble material was measured at given times. Means ± SEM of four experiments are shown. (B) Polysome profiles were determined using sucrose gradient sedimentation. HEK293 cells were pre-treated with either 10 mM AZC, or 20 μM MG132, or both for 60 min followed by polysome preparation. P/M ratio is calculated by comparing areas under the polysome and 80S peak. (C) HEK293 cells were treated with increasing doses of AZC (from 0 to 25 mM with 5-fold dilution) in the presence of 20 μM MG132 for 60 min, or increasing doses of NaAsO2 (from 0 to 1 mM with 2-fold dilution) for 60 min (left two panels), followed by immunoblotting using antibodies as indicated. The right two panels show the immunoblotting results of cells treated with 10 mM AZC and 20 μM MG132 or 500 μM NaAsO2 for various times (0, 10, 30, 60, 120, and 180 min) (D) The ribosomal half-transit time was determined in the absence or presence of 10 mM AZC and 20 μM MG132. Fitting lines of [35S] incorporation into total (filled circle) and completed (open triangle) protein synthesis are obtained by linear regression. Means ± SEM of three experiments are shown. (E) Schematic for nascent chain immunoprecipitation assay to differentiate elongation defect from initiation deficiency (left panel). HEK293 cells expressing Flag-GFP were pre-treated with 10 mM AZC and 20 μM MG132 or 500 μM NaAsO2 for various times (0, 10, 30, 60, 120, and 180 min). Immuno-precipitation was performed using anti-Flag antibody-coated beads followed by immunoblotting with anti-RpS6 antibody. The 0 time point serves as the control condition without any drug treatment. See also Figure S1.
Figure 2
Figure 2. Intracellular proteotoxic stress triggers early elongation pausing of ribosomes
(A) HEK293cells were treated with 10 mM AZC and 20 μM MG132 for 1 h before ribosome profiling. Ribosome densities of cells with or without treatment are plotted for comparison. The density in reads per kilobase of coding sequence per million mapped reads (rpkM) is a measure of overall translation along each transcript. (B) Ribosome density heat-maps of cells with or without treatment. The entire transcriptome is sorted based on total RPF reads and the top 15,000 transcripts are aligned in row. Both the first and last 160-codon regions of CDS are shown, together with flanking 40-codon untranslated regions. Reads density is represented in blue. White color indicates regions without reads, whereas yellow for regions without sequence. A short 5′UTR has yellow region before the AUG, whereas a short 3′UTR has yellow region after the stop codon. (C) Meta-gene analysis of early ribosome pausing of cells with or without treatment. Normalized RPF reads are averaged across the entire transcriptome, aligned at either their start (left panel) or stop (right panel) codon, and plotted as smoothed lines. (D) Ribosome pausing index (PI) is determined in a 50-codon window at the beginning (5′ end) and end (3′ end) of CDS, respectively. Both the 5′ and 3′ PI of each transcript in cells with or without treatment are shown in box plots with single dots as 5th/95th percentile. (E) Distribution of 5′PI changes in cells with proteotoxic stress. The log2 change of 5′PI after AZC and MG132 treatment is plotted, with the increase shown in grey bar and the decrease in black. (F) Changes of 5′PI and 3′PI after AZC and MG132 treatment. The log2 change is computed across the entire transcriptome and presented as a scatter plot with green dots for genes encoding ribosome subunits (RP) and red dots for mitochondria-encoded genes (Mito). (G) A typical example of early elongation pausing under proteotoxic stress. RPF reads density is shown on the CDS of RPS5 with or without AZC and MG132 treatment. See also Figure S2 – S4.
Figure 3
Figure 3. Disrupting endogenous Hsc70 recapitulates the effects of proteotoxic stress on early elongation pausing
(A) Sucrose cushion analysis of ribosome-associated Hsc70 along with AZC and MG132 treatment. Both the total and ribosome pellet were immunoblotted using antibodies as indicated. (B) Global protein synthesis was analyzed in HeLa-tTA cells infected with adenoviruses expressing Hsc70(WT) and Hsc70(K71M). Transgene expression was induced by 12 h Dox removal. [35S] radioactivity of TCA-insoluble material was measured at given times. Means ± SEM of three experiments are shown. (C) Polysome profiles were determined from cells as in (B) using sucrose gradient sedimentation. (D) Meta-gene analysis for early elongation pausing in cells with or without Hsc70(K71M) expression. Normalized RPF reads are averaged across the entire transcriptome, aligned at either their start (left panel) or stop (right panel) codon. (E) Both the 5′ and 3′ PI of each transcript in cells with or without Hsc70(K71M) expression are shown in box plots. (F) Changes of 5′PI and 3′PI after Hsc70(K71M) expression. The log2 change is computed across the entire transcriptome and presented as a scatter plot with green dots for genes encoding ribosome subunits and red dots for mitochondria- encoded genes. See also Figure S5.
Figure 4
Figure 4. Direct Hsc/Hsp70 inhibition induces early elongation pausing of ribosomes
(A) Schematic for chaperone targets of small molecule inhibitors. VER155008 inhibits Hsc70, Hsp70 and Grp78 (not shown); PES selectively inhibits Hsp70; whereas geldanamycin (GA) is a specific inhibitor of Hsp90. (B) Global protein synthesis was analyzed in HEK293 cells treated with 100 μM VER, 50 μM PES, or 1 μM GA for 1 h. [35S] radioactivity of TCA-insoluble material was measured at given times. Means ± SEM of three experiments are shown. (C) Polysome profiles were determined from cells treated with chaperone inhibitors as in (B) using sucrose gradient sedimentation. (D) Immunoblotting of whole cell lysates from cells treated with chaperone inhibitors as in (B). (E) Meta-gene analysis for early elongation pausing in cells treated with chaperone inhibitors as in (B). Normalized RPF reads are averaged across the entire transcriptome, aligned at their start codon. (F) The 5′ PI of each transcript in cells treated with chaperone inhibitors as in (B) are shown in box plots. See also Figure S6.
Figure 5
Figure 5. Co-translational interaction of nascent chains facilitates the elongation of polypeptides
(A) Effects of FKBP (blue ball) on the in vitro translation of FRB-GFP (red ball) in the absence or presence of 1 μM rapamycin (left panel). The right panel shows the effects of FRB (red ball) on the in vitro translation of FKBP-GFP (blue ball) in the absence or presence of 1 μM rapamycin. Autoradiography of full length GFP fusion protein is quantitated and plotted as a function of time. (B) HEK293 expressing FRB*-GFP was transfected with the plasmid encoding FKBP. Cells were pre-treated with 1 μM rapalog for 60 min before polysome profiling. The RPF density profiles are shown for the transgene FRB*-GFP with and without rapalog treatment. The RPF reads density is normalized based on the FRB* domain. The average change of RPF density over the entire GFP region (blue dot line) and single codon change (green line) are plotted together (Wilcoxon signed-rank test, p-value = 3 × 10⁻⁴). See also Figure S7 (C) Schematic of experimental design using recombinant Hsc70 protein to restore translation efficiency using an in vitro translation system programmed from cells with or without proteotoxic stress. The right panel shows the relative translation efficiency of a synthesized bicistronic mRNA containing a polio IRES element between Rluc and Fluc. Error bar: SEM. **, p < 0.001. (D) The in vitro translation system as (C) was used to translate a synthesized Fluc mRNA in the absence or presence of recombinant Hsc70. Error bar: SEM. **, p < 0.01.
Figure 6
Figure 6. A model for co-translational stress response via early ribosome pausing
The cytosolic chaperone molecules, such as Hsc70 (green), not only assist the co-translational folding, but also facilitate the elongation of emerging polypeptides (red). Under the condition of proteotoxic stress, the accumulation of misfolded proteins titrates out molecular chaperones. The lack of co-translational interaction of chaperone molecules leads to early elongation pausing and rapid suppression of global protein synthesis.

References

    1. Albanese V, Yam AY, Baughman J, Parnot C, Frydman J. Systems analyses reveal two chaperone networks with distinct functions in eukaryotic cells. Cell. 2006;124:75–88. - PubMed
    1. Buchan JR, Parker R. Eukaryotic stress granules: the ins and outs of translation. Mol Cell. 2009;36:932–941. - PMC - PubMed
    1. Bukau B, Weissman J, Horwich A. Molecular chaperones and protein quality control. Cell. 2006;125:443–451. - PubMed
    1. Choi J, Chen J, Schreiber SL, Clardy J. Structure of the FKBP12-rapamycin complex interacting with the binding domain of human FRAP. Science. 1996;273:239–242. - PubMed
    1. del Alamo M, Hogan DJ, Pechmann S, Albanese V, Brown PO, Frydman J. Defining the specificity of cotranslationally acting chaperones by systematic analysis of mRNAs associated with ribosome-nascent chain complexes. PLoS Biol. 2011;9:e1001100. - PMC - PubMed

Publication types

MeSH terms