. 2013 Feb 15;85(4):570-82.
doi: 10.1016/j.bcp.2012.12.019. Epub 2013 Jan 2.

Urinary chemokine (C-C motif) ligand 2 (monocyte chemotactic protein-1) as a tubular injury marker for early detection of cisplatin-induced nephrotoxicity

Affiliations

Urinary chemokine (C-C motif) ligand 2 (monocyte chemotactic protein-1) as a tubular injury marker for early detection of cisplatin-induced nephrotoxicity

Kumiko Nishihara et al. Biochem Pharmacol. .

Abstract

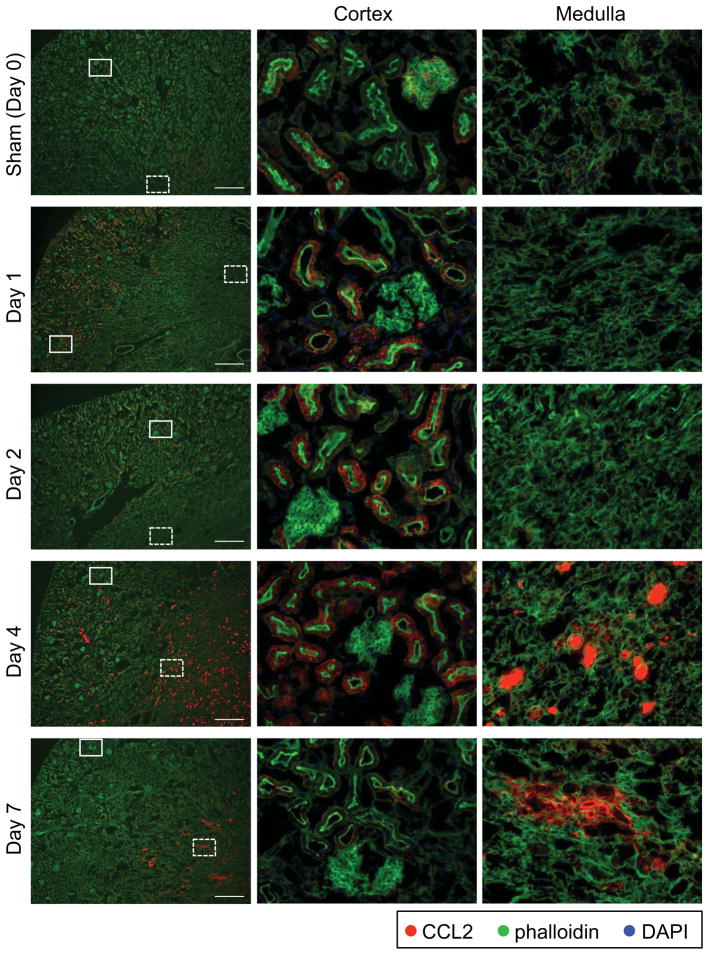
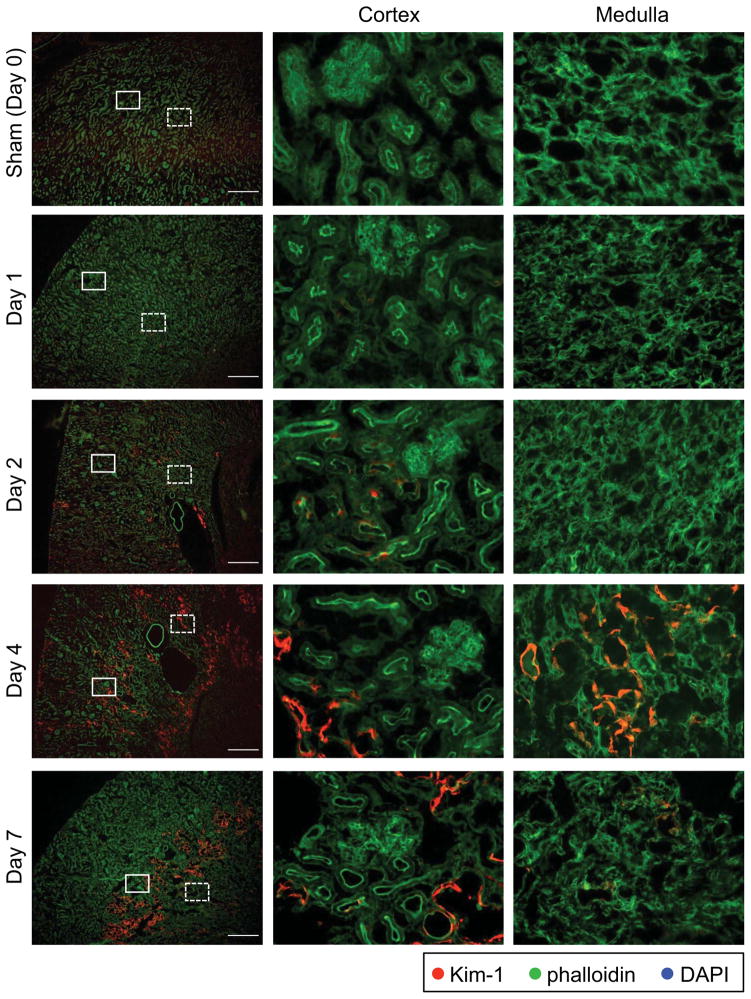
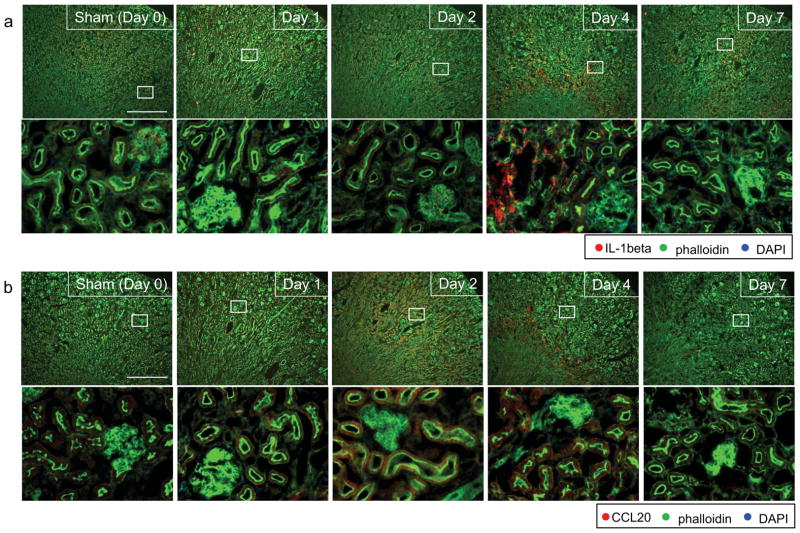
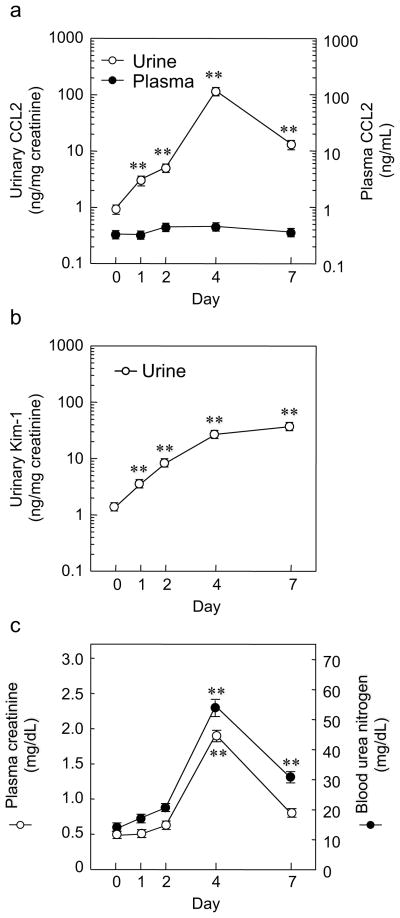
Because of the difficulty in detecting segment-specific response in the kidney, we investigated the molecular events underlying acute kidney injury in the proximal tubules of rats with cisplatin (cis-diamminedichloroplatinum II)-induced nephrotoxicity. Microarray analysis revealed that mRNA levels of several cytokines and chemokines, such as interleukin-1beta, chemokine (C-C motif) ligand (CCL) 2, CCL20, chemokine (C-X-C motif) ligand (CXCL) 1, and CXCL10 were significantly increased after cisplatin treatment in both isolated proximal tubules and whole kidney. Interestingly, tubular CCL2 mRNA levels increased soon after cisplatin administration, whereas CCL2 mRNA levels in whole kidney first decreased and then increased. Levels of both CCL2 and kidney injury molecule-1 (KIM-1) in the whole kidney increased after cisplatin administration. Immunofluorescence analysis revealed CCL2 changes in the proximal tubular cells initially and then in the medullary interstitium. Urinary CCL2 excretion significantly increased approximately 3-fold compared with controls the day after cisplatin administration (5mg/kg), when no changes were observed plasma creatinine and blood urea nitrogen levels. Urinary levels of KIM-1 also increased 3-fold after cisplatin administration. In addition, urinary CCL2 rather than KIM-1 increased in chronic renal failure rats after administration of low-dose cisplatin (2mg/kg), suggesting that urinary CCL2 was selective for cisplatin-induced nephrotoxicity in renal impairment. These results indicated that the increase in cytokine and chemokine expression in renal epithelial cells might be responsible for kidney deterioration in cisplatin-induced nephrotoxicity, and that urinary CCL2 is associated with tubular injury and serves as a sensitive and noninvasive marker for the early detection of cisplatin-induced tubular injury.


Figures

Figure 1
Figure 1. Time-dependent changes in renal function and histology of rats treated with 5 mg/kg cisplatin
The changes in creatinine clearance (Ccr), blood urea nitrogen (BUN), urinary excretion of albumin, and urinary N-acetyl-β-D-glucosaminidase (NAG) activity 1, 2, 4, and 7 days after cisplatin administration are shown (a). Histological analyses of the kidneys are also shown (b). *, glomeruli. Data are expressed as means ± standard error (S.E.) of 6 rats. Multiple comparisons were performed with Dunnett’s 2-tailed test after 1-way analysis of variance (ANOVA). * P < 0.05, **P < 0.01, significantly different from the value on day 0.
Figure 2
Figure 2. Cytokine and chemokine expression profiles of rats treated with 5 mg/kg cisplatin
Interleukin (IL)-1beta (a), chemokine (C-C motif) ligand (CCL) 2 (b), CCL20 (c), chemokine (C-X-C motif) ligand (CXCL) 1 (d), and CXCL10 (e) mRNA levels were examined. Whole-kidney total RNA was extracted from rats 1, 2, 4, and 7 days after cisplatin treatment and reverse-transcribed to complementary DNA (cDNA). Real-time PCR analysis was performed using these cDNAs. Glyceraldehyde-3-phosphate dehydrogenase (GAPDH) mRNA was used as an internal control. Data are expressed as means ± S.E. of 6 rats. Multiple comparisons were performed with Dunnett’s 2-tailed test after 1-way ANOVA. *P < 0.05, **P < 0.01, significantly different from the value on day 0.
Figure 3
Figure 3. Comparison of CCL2 and kidney injury molecule-1 (Kim-1) expression in the kidney
(a) and (b), Total RNA was extracted from isolated proximal tubules (open circles) and whole kidneys (closed circles) of rats treated with 5 mg/kg cisplatin. This RNA was reverse-transcribed to yield cDNA. Real-time polymerase chain reaction analysis of CCL2 (a) and Kim-1 (b) was performed using these cDNAs. GAPDH mRNA was used as an internal control. Ratio to day 0 was calculated, and data are expressed as means ± S.E. of 3–5 rats. Multiple comparisons were performed with Dunnett’s 2-tailed test after 1-way ANOVA. *P < 0.05, **P < 0.01, significantly different from the value at day 0. (c) and (d), Lysate samples were prepared from whole kidneys of rats treated with 5 mg/kg cisplatin. CCL2 concentrations were measured using enzyme-linked immunosorbent assay (ELISA) kits (c), and Kim-1 levels were determined with microsphere-based Luminex xMAP technology developed in the Vaidya/Bonventre laboratory [14, 15] (d). Multiple comparisons were performed with Dunnett’s two-tailed test after one-way ANOVA. Data are expressed as means ± SE of 5 rats. *P < 0.05, **P < 0.01, and ***P < 0.001, significantly different from the value on day 0.
Figure 4
Figure 4. Immunofluorescence analysis of CCL2 in rats treated with cisplatin
Rats treated with 5 mg/kg cisplatin were used. Kidneys were perfused, fixed with 4% paraformaldehyde, and embedded. The sections (5 μm) were stained with an antibody specific for CCL2 (red), phalloidin (green), and 4′,6-diamidino-2-phenylindole (DAPI; blue). Scale bar, 100 μm. The solid and dotted frames indicate magnifications of the cortex and medullary regions, respectively. Magnification: left panels, ×40; middle and right panels, ×400.
Figure 5
Figure 5. Immunofluorescence analysis of Kim-1 in rats treated with cisplatin
Rats treated with 5 mg/kg cisplatin were used. The kidneys were perfused, fixed with 4% paraformaldehyde, and embedded. The sections (5 μm) were stained with an antibody specific for Kim-1 (red), phalloidin (green), and DAPI (blue). Scale bar, 100 μm. The solid and dotted frames indicate magnifications of the cortex and medullary regions, respectively. Magnification: left panels, ×40; middle and right panels, ×400.
Figure 6
Figure 6. Immunofluorescence analysis of IL-1beta (a), CCL20 (b), CXCL1 (c), and CXCL10 (d) in rats treated with cisplatin
Rats treated with 5 mg/kg cisplatin were used. The kidneys were perfused, fixed with 4% paraformaldehyde, and embedded. The sections (5 μm) were stained with antibodies specific for IL-1beta, CCL20, CXCL1, or CXCL10. Red signals for each section were merged with green signals for phalloidin and with blue signals for DAPI. Scale bar, 100 μm. The solid frame indicates the magnification region. Magnification, ×400.
Figure 7
Figure 7. Measuring urinary and plasma CCL2 and urinary Kim-1 in rats treated with 5 mg/kg cisplatin
CCL2 concentrations in bladder urine (open circles) and plasma (closed circles) in rats given 5 mg/kg cisplatin were measured using enzyme-linked immunosorbent assay (ELISA) kits (a). Kim-1 urinary levels were determined with microsphere-based Luminex xMAP technology developed in the Vaidya/Bonventre laboratory [14, 15] (b). Concentrations of urinary CCL2 and Kim-1 were normalized to urinary creatinine concentration. Plasma creatinine (open circles) and blood urea nitrogen (closed circles) levels in rats after administration of 5 mg/kg cisplatin are shown (c). Multiple comparisons were performed with Dunnett’s 2-tailed test after 1-way ANOVA. Data are expressed as means ± S.E. of 5–7 rats. **P < 0.01, significantly different from the value on day 0.
Figure 8
Figure 8. Measuring urinary and plasma CCL2 and urinary Kim-1 in nephrectomized rats treated with 2 mg/kg cisplatin
CCL2 concentrations in bladder urine (a) or plasma (b) in nephrectomized rats given saline (vehicle, open circles) or 2 mg/kg cisplatin (closed circles) were measured using ELISA kits. Kim-1 urinary levels in nephrectomized rats given saline (vehicle, open circles) or 2 mg/kg cisplatin (closed circles) were determined with microsphere-based Luminex xMAP technology developed in the Vaidya/Bonventre laboratory [14, 15] (c). Concentrations of urinary CCL2 and KIM-1 were normalized to urinary creatinine concentration. Plasma creatinine (open circles) and blood urea nitrogen levels (closed circles) in nephrectomized rats after administration of corn oil (vehicle, open circle) or 2 mg/kg cisplatin (closed circle) are shown (d). Multiple comparisons were performed with Dunnett’s 2-tailed test after 1-way ANOVA. Data are expressed as means ± S.E. of 8 rats. **P < 0.01, significantly different from the value on day 0.

Similar articles

Cited by

References

    1. Perazella MA. Renal vulnerability to drug toxicity. Clin J Am Soc Nephrol. 2009;4:1275–83. - PubMed
    1. Mehta RL, Pascual MT, Soroko S, Savage BR, Himmelfarb J, Ikizler TA, et al. Spectrum of acute renal failure in the intensive care unit: the PICARD experience. Kidney Int. 2004;66:1613–21. - PubMed
    1. Inui K, Masuda S, Saito H. Cellular and molecular aspects of drug transport in the kidney. Kidney Int. 2000;58:944–58. - PubMed
    1. Williams CJ, Whitehouse JM. Cis-platinum: a new anticancer agent. Br Med J. 1979;1:1689–91. - PMC - PubMed
    1. Yonezawa A, Masuda S, Nishihara K, Yano I, Katsura T, Inui K. Association between tubular toxicity of cisplatin and expression of organic cation transporter rOCT2 (Slc22a2) in the rat. Biochem Pharmacol. 2005;70:1823–31. - PubMed

Publication types

MeSH terms