. 2013 Mar;14(3):254-61.
doi: 10.1038/ni.2513. Epub 2013 Jan 6.

MHC class I-restricted myelin epitopes are cross-presented by Tip-DCs that promote determinant spreading to CD8⁺ T cells

Affiliations

MHC class I-restricted myelin epitopes are cross-presented by Tip-DCs that promote determinant spreading to CD8⁺ T cells

Qingyong Ji et al. Nat Immunol. 2013 Mar.

Abstract

Myelin presentation to T cells in the central nervous system (CNS) sustains inflammation in multiple sclerosis (MS). CD4(+) and CD8(+) T cells contribute to MS, but only cells that present myelin to CD4(+) T cells have been identified. We show that MHC class I-restricted myelin basic protein (MBP) was presented by oligodendrocytes and cross-presented by Tip-dendritic cells (DCs) during experimental autoimmune encephalomyelitis (EAE), an animal model of MS initiated by CD4(+) T cells. Tip-DCs activated naive and effector CD8(+) T cells ex vivo, and naive MBP-specific CD8(+) T cells were activated in the CNS during CD4(+) T cell-induced EAE. These results demonstrate that CD4(+) T cell-mediated CNS autoimmunity leads to determinant spreading to myelin-specific CD8(+) T cells that can directly recognize oligodendrocytes.


Conflict of interest statement

COMPETING FINANCIAL INTERESTS

The authors declare no competing financial interests.

Figures

Figure 1
Figure 1
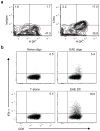
Detection of MBP–H2-Kk by the 12H4 antibody and MBP-specific CD8+ T cells. (a) Effector CD8+ 8.6 T cells were incubated with CNS cells isolated from either naïve or EAE mice and IFN- γ production was analyzed on gated CD8+ cells (representative of two independent experiments). (b) RMA-S-Kk cells pulsed with either MBP79–87 (solid line) or TAg560–568 peptide (dotted line) were stained with 12H4 or isotype control antibody (shaded) followed by FITC-conjugated anti-mouse IgG (left panel). Peptide-pulsed cells were separately stained for Kk (right panel). Data are representative of three independent experiments. (c) Effector 8.6 T cells were incubated with MBP peptide-pulsed and paraformaldehyde-fixed splenocytes (top panel), or paraformaldehyde-fixed CNS cells from an EAE mouse (middle panel), and TAg-specific T cells were incubated with TAg-pulsed and fixed splenocytes (bottom panel) in the presence of either 12H4 or control IgG2a antibody. IFN- γ production was analyzed as in a. Data are representative of three independent experiments.
Figure 2
Figure 2
MBP–H2-Kk is presented predominantly by DCs in the CNS during CD4+ T cell-mediated EAE. (a) CNS cells from a mouse with EAE were stained with 12H4 (or isotype control), anti-Kk and antibodies used to distinguish DCs, macrophages and microglia and analyzed by flow cytometry (gating strategy is shown in Supplementary Figure 1). Data are representative of at least ten mice analyzed in five independent experiments. (b) 8.6 effector T cells were incubated either alone or with DCs, macrophages or microglia sorted from CNS cells from EAE mice and analyzed in an intracellular IFN- γ staining assay. Data are gated on CD8+ T cells and representative of two independent experiments.
Figure 3
Figure 3
MBP–H2-Kk+ DCs in EAE mice are phenotypically similar to tissue-infiltrating inflammatory monocytes. CNS cells were isolated from EAE mice and stained with 12H4 and antibodies specific for CD11c, CD45 and the indicated cell-surface antigens. Analyses are gated on CD45HiCD11c+ cells. Peripheral blood monocytes were also isolated from rMOG-immunized mice and stained for CD11b, Ly6C and CCR2; CCR2 expression is shown on CD11b+Ly6C+ gated cells in the lower right panel. Data are representative of 2–3 independent experiments for each cell marker.
Figure 4
Figure 4
MBP–H2-Kk+ DCs are CD11bHiCD103Int non-classical DCs. (a) CNS cells from EAE mice stained with 12H4 and antibodies specific for CD11b, CD11c, CD45 and CD103; flow cytometry analyses are gated on CD45HiCD11c+ cells. Data are representative of four independent experiments. (b) Quantitative PCR analysis of cDNA from CD45+CD11c+ CNS cells from EAE mice sorted into 12H4+CD103Int and 12H4 CD103 fractions, and from splenocytes from naive mice sorted into CD11c+CD8+ and CD11c+CD8 fractions. Primers are shown in Supplementary Table 1; values are expressed relative to HPRT. Reactions were performed in duplicate; data are representative of two independent experiments. ND, not detected. *P < 0.02, **P < 0.005, ***P < 0.001, NS, not significant. Error bars, s.d.
Figure 5
Figure 5
MBP–H2-Kk+ CNS DCs in mice with CD4+ T cell-mediated EAE are Tip-DCs that facilitate determinant spreading to CD8+ T cells. (a) CNS cells from EAE mice were stained for TNF-α (top panel). Data shown are gated on CD45HiCD11c+ cells and representative of two independent experiments analyzing more than four mice. Quantitative PCR analysis of iNOS and CCR7 cDNA was performed on 12H4+CD103Int and 12H4 CD103 DCs sorted from the CNS of EAE mice (bottom panel). Values are expressed relative to HPRT; reactions were performed in duplicate; data are representative of two independent experiments. *P < 0.02 and **P < 0.001. Error bars, s.d. (b) Quantitative PCR analysis of golli-MBP cDNA from the CNS of a naive mouse, L cells, and 12H4+CD103Int and 12H4 CD103 DCs sorted from a mouse with EAE. ND, not detected. *P < 0.02 and **P < 0.001. (c) DCs, macrophages, and microglia were sorted from the CNS of EAE mice and cultured with naive CD8+ 8.6 T cells. Proliferation was measured by 3H-thymidine incorporation. Results are expressed as counts per minute (c.p.m) ± standard deviation (s.d.). Data are representative of two independent experiments. (d). EAE was induced by adoptive transfer of genetically-marked MOG-specific CD4+ T into 8.8 mice. Splenocytes and CNS cells were harvested at peak of disease and stained for CD62L, CD44, and CD69. Analyses are gated on host CD8+ T cells; data are representative of two mice analyzed in two independent experiments.
Figure 6
Figure 6
Oligodendrocytes present MBP–H2-Kk during CD4+ T cell-mediated EAE. (a) CNS cells were isolated from PLP-GFP transgenic mice (oligodendrocytes specifically express GFP) with EAE, cultured for two hours and stained with antibodies specific for CD45, Kk and either 12H4 or isotype control antibody. Data shown are gated on CD45 GFP+ cells and representative of two independent experiments using more than four mice. (b) Effector 8.6 T cells were cultured with oligodendrocytes sorted from PLP-GFP transgenic naïve or EAE mice, or with DCs from EAE mice and stained for IFN- γ. Data are gated on CD8+ T cells and representative of two independent experiments.
Figure 7
Figure 7
DCs from the CNS of naive mice present MBP–H2-Kk. (a) CNS cells isolated from naïve mice were stained with antibodies specific for CD45, CD11c, CD11b, Kk and either 12H4 or isotype control antibody. CNS cell subsets were gated as in Supplementary Figure 1; data are representative of more than five independent experiments. (b) DCs/macrophages (CD45HiCD11bHi), microglia (CD45IntCD11b+), and endothelial cells (CD45 CD31+) were sorted from naive CNS cells and incubated with effector 8.6 T cells in an ELISPOT assay to detect IFN-γ-secreting cells. Data are pooled from three independent experiments and expressed as the mean values ± standard deviation (s.d.). (c) CNS cells from naïve or EAE mice were stained for CD11c, CD45, CD80, and CD86 and analyzed by gating on CD45HiCD11c+ cells from naive mice (dashed line) and EAE mice (solid line). Grey shaded area shows isotype control staining. (d) CNS cells from naïve mice were stained with 12H4 and antibodies specific for CD11c, CD45 and the indicated markers and analyzed by gating on CD45HiCD11c+ cells. Data are representative of two independent experiments.

Comment in

References

    1. Goverman J. Autoimmune T cell responses in the central nervous system. Nat Rev Immunol. 2009;9:393–407. - PMC - PubMed
    1. Tompkins SM, et al. De novo central nervous system processing of myelin antigen is required for the initiation of experimental autoimmune encephalomyelitis. J Immunol. 2002;168:4173–4183. - PubMed
    1. Kawakami N, et al. The activation status of neuroantigen-specific T cells in the target organ determines the clinical outcome of autoimmune encephalomyelitis. J Exp Med. 2004;199:185–197. - PMC - PubMed
    1. Greter M, et al. Dendritic cells permit immune invasion of the CNS in an animal model of multiple sclerosis. Nat Med. 2005;11:328–334. - PubMed
    1. King IL, Dickendesher TL, Segal BM. Circulating Ly-6C+ myeloid precursors migrate to the CNS and play a pathogenic role during autoimmune demyelinating disease. Blood. 2009;113:3190–3197. - PMC - PubMed

Publication types

MeSH terms