. 2013 Feb;19(2):209-16.
doi: 10.1038/nm.3043. Epub 2013 Jan 6.

Recoding RNA editing of AZIN1 predisposes to hepatocellular carcinoma

Affiliations

Recoding RNA editing of AZIN1 predisposes to hepatocellular carcinoma

Leilei Chen et al. Nat Med. 2013 Feb.

Abstract

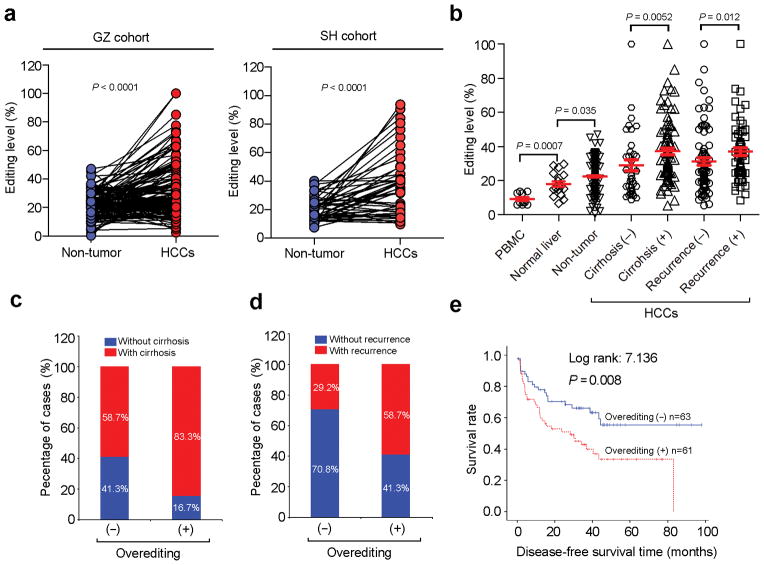
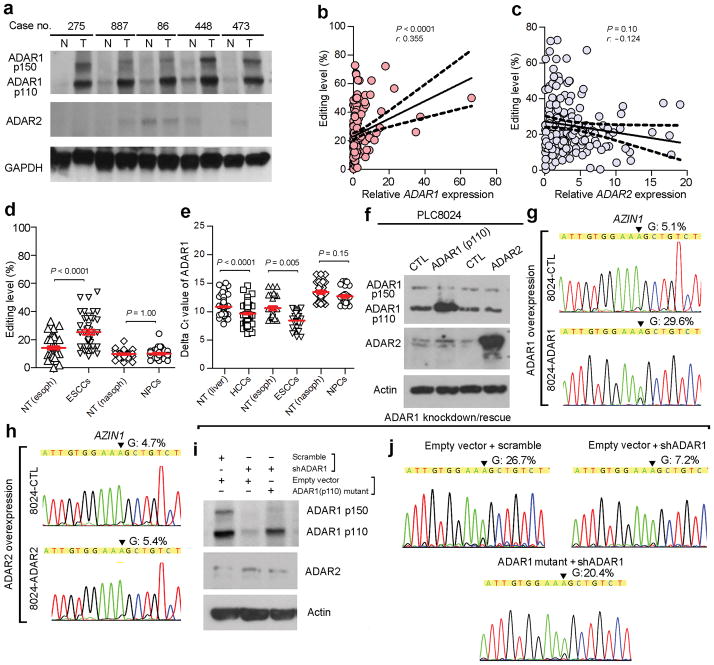
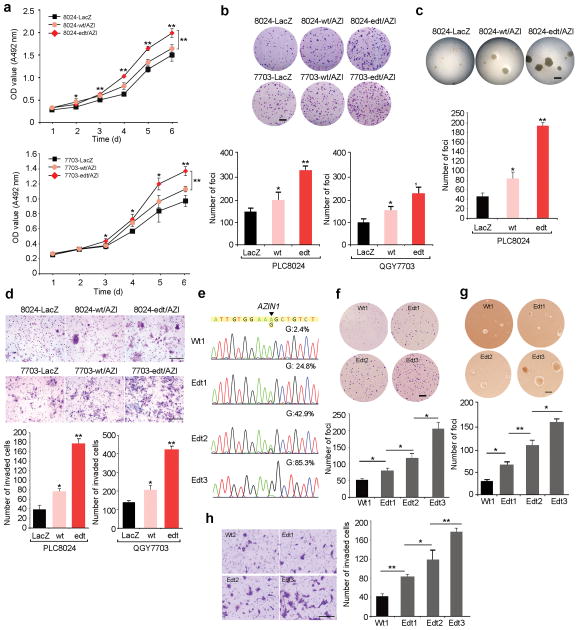
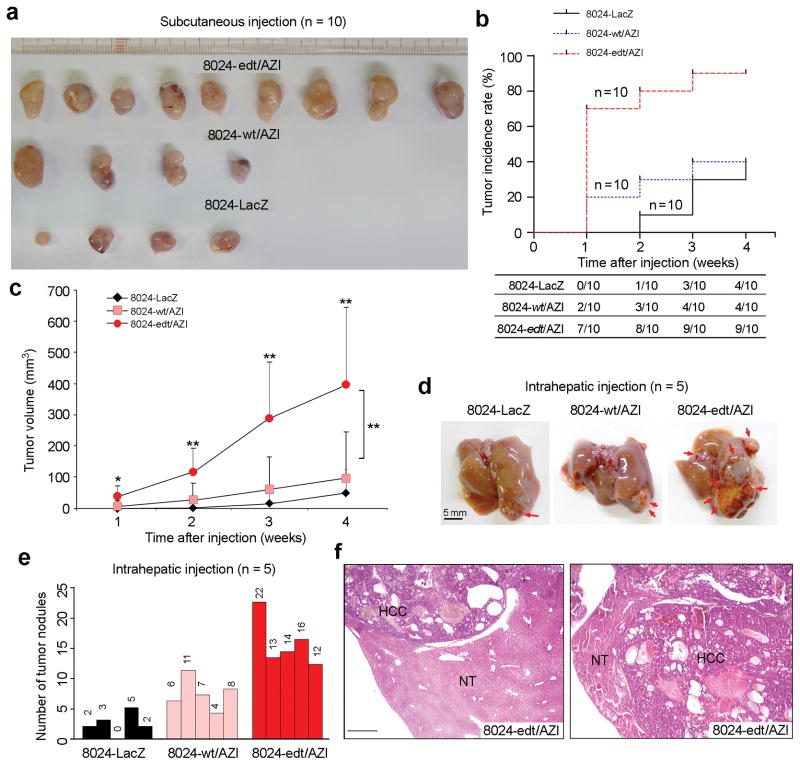
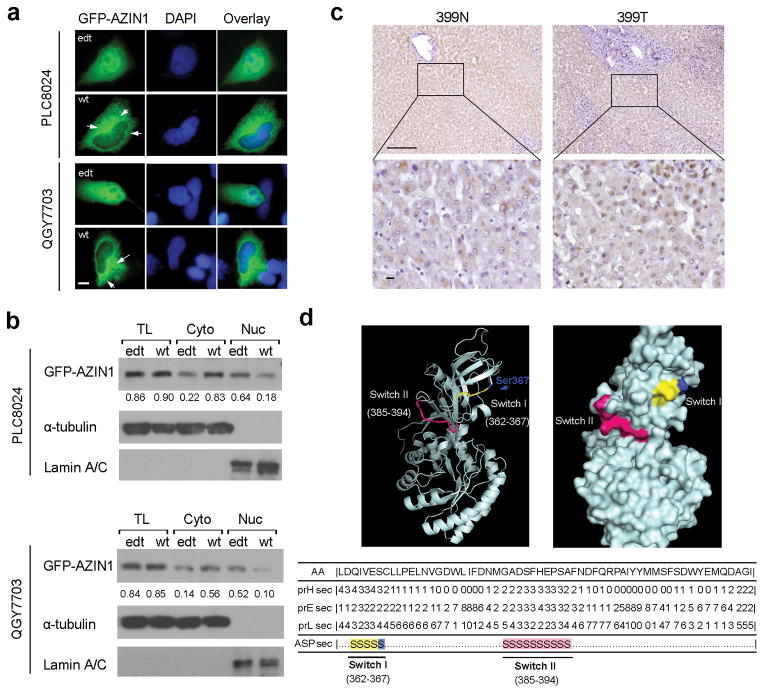
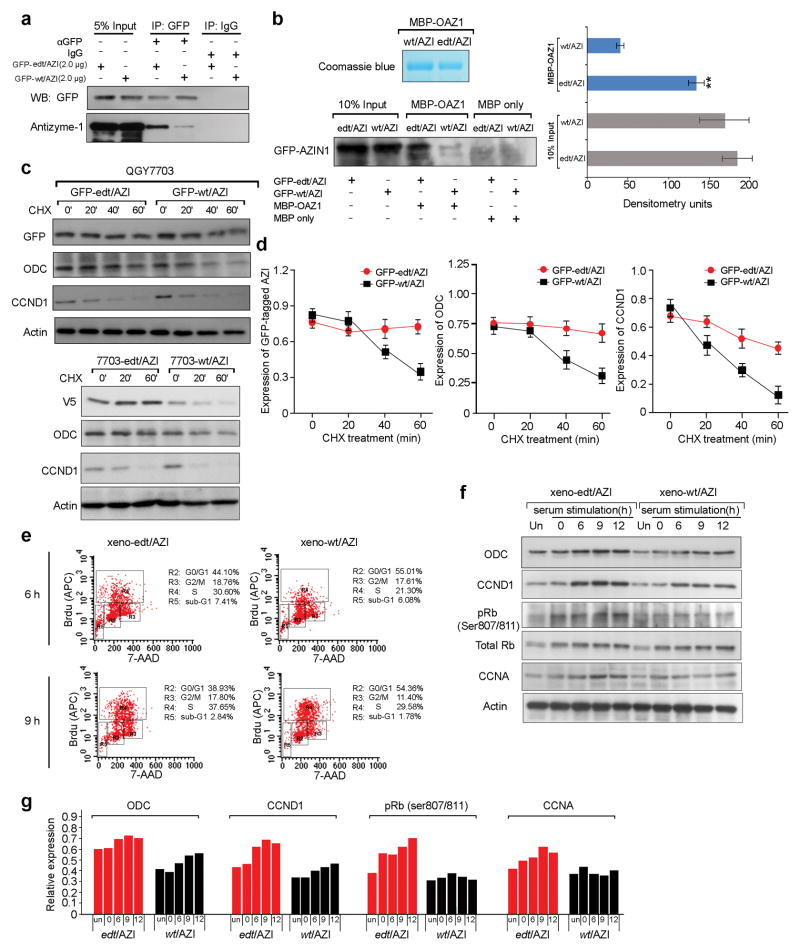
A better understanding of human hepatocellular carcinoma (HCC) pathogenesis at the molecular level will facilitate the discovery of tumor-initiating events. Transcriptome sequencing revealed that adenosine-to-inosine (A→I) RNA editing of AZIN1 (encoding antizyme inhibitor 1) is increased in HCC specimens. A→I editing of AZIN1 transcripts, specifically regulated by ADAR1 (encoding adenosine deaminase acting on RNA-1), results in a serine-to-glycine substitution at residue 367 of AZIN1, located in β-strand 15 (β15) and predicted to cause a conformational change, induced a cytoplasmic-to-nuclear translocation and conferred gain-of-function phenotypes that were manifested by augmented tumor-initiating potential and more aggressive behavior. Compared with wild-type AZIN1 protein, the edited form has a stronger affinity to antizyme, and the resultant higher AZIN1 protein stability promotes cell proliferation through the neutralization of antizyme-mediated degradation of ornithine decarboxylase (ODC) and cyclin D1 (CCND1). Collectively, A→I RNA editing of AZIN1 may be a potential driver in the pathogenesis of human cancers, particularly HCC.


Conflict of interest statement

COMPETING FINANCIAL INTERESTS

The authors declare no competing financial interests.

Figures

Figure 1
Figure 1
AZIN1 overediting is strongly associated with HCC pathogenesis. (a) AZIN1 editing levels in HCC and matched non-tumor (NT) liver specimens from 135 and 46 patients in the Guangzhou (GZ) (left panel) and Shanghai (SH) cohorts (right panel), respectively (paired Student’s t-test). (b) Dot plots represent AZIN1 editing levels in healthy human peripheral blood mononuclear cells (PBMCs) (n = 10), healthy human liver tissues (n = 20), and adjacent NT liver specimens of 135 patients with HCC from the GZ cohort (Mann-Whitney U test). Matched HCC specimens were subdivided into four categories according to the presence of cirrhosis or tumor recurrence. (c) Association between presence of liver cirrhosis and AZIN1overediting (chi-square test). (d) Association between recurrence incidence and AZIN1 overediting (chi-square test). (e) Kaplan-Meier plots for the disease-free survival rate of patients with HCC in “overediting (+)” and “overediting (−)” groups (Log rank test).
Figure 2
Figure 2
ADAR1 directs A-to-I AZIN1 RNA Editing. (a) Western blot showing expression of ADAR1 and ADAR2 proteins in HCC (T) and matched non-tumor liver (N) (Case No. 275, 887, 86, 448, and 473) specimens. GAPDH is the loading control. (b, c) Correlation between relative RNA levels of ADAR1 (b) and ADAR2 (c) and AZIN1 editing in tumor and NT specimens from 94 patients with HCC in the GZ cohort, expressed using Spearman correlation coefficients, linear regression (solid lines), and the 95% confidence interval (dotted lines). (d) Dot plots representing the AZIN1 editing in ESCC and NPC and in paired NT samples by pyrosequencing (ESCCs: n = 43; NPCs: n = 33; Mann-Whitney U test). (e) Dot plots representing the delta Ct (ΔCt) values of ADAR1 in the same samples described in (b) and (d) by QPCR (Mann-Whitney U test). (f) Western blot showing expression of ADAR1 and ADAR2 proteins in PLC8024 cells transiently transfected with the indicated expression constructs. (g, h) Sequence chromatograms of the AZIN1 transcript in the indicated cell lines; the arrow indicates the edited position. (i) Western blot of ADAR1 and ADAR2 in H2M cells transiently transfected with expression plasmids as indicated. (j) Sequence chromatograms of the AZIN1 transcript in the indicated cell lines. The percentage of edited AZIN1 transcripts was detected by pyrosequencing. An arrow indicates the editing position.
Figure 3
Figure 3
AZIN1 RNA editing confers enhanced tumorigenicity. (a) XTT assays showing growth rates of the indicated stable cell lines. (*, P < 0.05; **, P < 0.01). (b) Quantification of foci formation induced by the indicated stable cell lines (*, P < 0.05; **, P < 0.001). Scale bar: 0.5 cm. (c) Quantification of soft agar colonies induced by the indicated stable cell lines (*, P < 0.05; **, P < 0.001). Scale bar: 100 μm. (d) Quantification of cells from the indicated stable cells that invaded through Matrigel-coated membrane (*, P < 0.05; **, P < 0.001). (e) Direct sequencing of the AZIN1 transcripts from the indicated cell lines. The percentage of edited AZIN1 transcripts was determined by pyrosequencing. An arrow indicates the editing position. (f, g) Quantification of foci formation (f) and colony formation in soft agar (g) induced by 8024-Wt1, Edt1, Edt2 and Edt3 cells (*, P < 0.05; **, P < 0.001). Scale bar: f, 1 cm; g, 100 μm. (h) Quantification of cells from the indicated stable cells that invaded through Matrigel-coated membrane (*, P < 0.05; **, P < 0.001). Scale bar: 200 μm. For all panels, data are presented as mean ± s.e.m of three independent experiments and statistical significance determined by unpaired, two-tailed Student’s t test.
Figure 4
Figure 4
AZIN1 editing contributes to augmented tumor initiating potential and enhanced in vivo tumorigenic ability. (a) Tumors derived from 8024-LacZ, 8024-wt/AZI and 8024-edt/AZI cells 4 weeks post subcutaneous injection (n = 10 per group). (b) Cumulative tumor incidence curves of severe combined immunodeficient (SCID) mice from the indicated cell lines estimated by the Kaplan-Meier method. (c) Growth curves of tumors derived from the indicated cell lines over a period of 4 weeks (*, P<0.05; **, P<0.01). Statistical significance was determined by unpaired, two-tailed Student’s t test. (d) Representative images of mouse livers that underwent intrahepatic inoculation with 8024-wt/AZI, 8024-edt/AZI and 8024-LacZ cells 4 weeks post-injection (n = 5). Arrows indicate focal tumor nodules on liver surfaces. Scale bar: 5 mm. (e) The numbers of tumor nodules (larger than 1 mm in diameter). (f) H&E staining showing severe HCC lesions in 8024-edt/AZI-injected livers. NT, adjacent non-tumor. Scale bar: 200 μm.
Figure 5
Figure 5
RNA editing of AZIN1 changes subcellular localization. (a) GFP-tagged wild-type or edited AZIN1 protein expressed in QGY7703 and PLC8024 cells. Images on the right are the overlay of GFP-tagged AZIN1 and nuclear DAPI (blue) staining of the same field. Arrows indicate centrosomal localization of wild-type AZIN1 protein. Scale bar, 10 μm. (b) Western blot of GFP-tagged wild-type and edited AZIN1 protein in the total lysate (TL), cytoplasmic (Cyto), and nuclear (Nuc) fractions of PLC8024 and QGY7703 cells transfected with GFP-wt/AZI or GFP-edt/AZI constructs. Lamin A/C and α-tubulin are loading controls for nuclear and cytoplasmic fractions, respectively. (c) Immunohistochemical (IHC) staining of AZIN1 for a pair of tumor (399T) and matched NT (399N) tissues from HCC patient (Case No. 399) with AZIN1 overediting in the tumor. The boxed regions are magnified and shown in the lower panels. Scale bar, 200 μm. (d) Predicted conformational switch regions of AZIN1 protein. Lower panel: Two predicted individual switching elements (Switch I and Switch II). Switch I comprises residues 362–367 (yellow); residue Ser367 corresponding to the edited codon is highlighted in blue; Switch II comprises residues 385–394 (pink). Upper-left panel: Ribbon drawing; Upper-right panel: Surface diagram.
Figure 6
Figure 6
Edited AZIN1 neutralizes antizyme-mediated degradation of target oncoproteins in vitro and in vivo. (a) Co-immunoprecipitation of antizyme-1 in PLC8024 cells transfected with the indicated constructs using a GFP-specific antibody (IP: GFP) or mouse IgG (IP: IgG). (b) Western blot of GFP-tagged AZIN1 showing the binding affinities of wild-type and edited AZIN1 protein to maltose-binding protein (MBP)-fused antizyme-1 (MBP-OAZ1) or MBP resin beads (MBP only). “10% Input” indicates 10% of whole cell lysates from HEK293T cells transfected with the indicated constructs. Data are presented as mean ± s.e.m of three independent experiments and statistical significance determined by unpaired, two-tailed Student’s t test (**, P < 0.00001). (c, d) Western blot demonstrating expression of tagged AZIN1, ODC, and CCND1 in QGY7703 cells transfected with GFP-edt/AZI or GFP-wt/AZI or in stable cell lines (7703-edt/AZI and 7703-wt/AZI) after cycloheximide (CHX) treatment (50 μg ml−1) for the indicated times in minutes. Data are presented as mean ± s.e.m of three independent experiments (d). (e) Scatter plots of fluorescence intensities of BrdU incorporation (APC anti-BrdU, Y axis) against DNA content (7-AAD, X-axis) for each cell line at 6 and 9 hours after release. (f, g) Western blot of ODC, CCND1, pRb, total Rb, and CCNA in xeno-wt/AZI and xeno-edt/AZI cells at each time point. Protein levels were quantified and expressed as the average of two independent experiments (g).

Comment in

References

    1. Parkin DM, Bray F, Ferlay J, Pisani P. Global cancer statistics, 2002. CA Cancer J Clin. 2005;55:74–108. - PubMed
    1. Farazi PA, DePinho RA. Hepatocellular carcinoma pathogenesis: from genes to environment. Nat Rev Cancer. 2006;6:674–687. - PubMed
    1. Thorgeirsson SS, Grisham JW. Molecular pathogenesis of human hepatocellular carcinoma. Nat Genet. 2002;31:339–346. - PubMed
    1. Meyerson M, Gabriel S, Getz G. Advances in understanding cancer genomes through second-generation sequencing. Nat Rev Genet. 11:685–696. - PubMed
    1. Morozova O, Marra MA. Applications of next-generation sequencing technologies in functional genomics. Genomics. 2008;92:255–264. - PubMed

Publication types