. 2013 May;25(5):295-306.
doi: 10.1093/intimm/dxs114. Epub 2013 Jan 4.

Phenotype and function of B cells and dendritic cells from interferon regulatory factor 5-deficient mice with and without a mutation in DOCK2

Affiliations

Phenotype and function of B cells and dendritic cells from interferon regulatory factor 5-deficient mice with and without a mutation in DOCK2

Kei Yasuda et al. Int Immunol. 2013 May.

Abstract

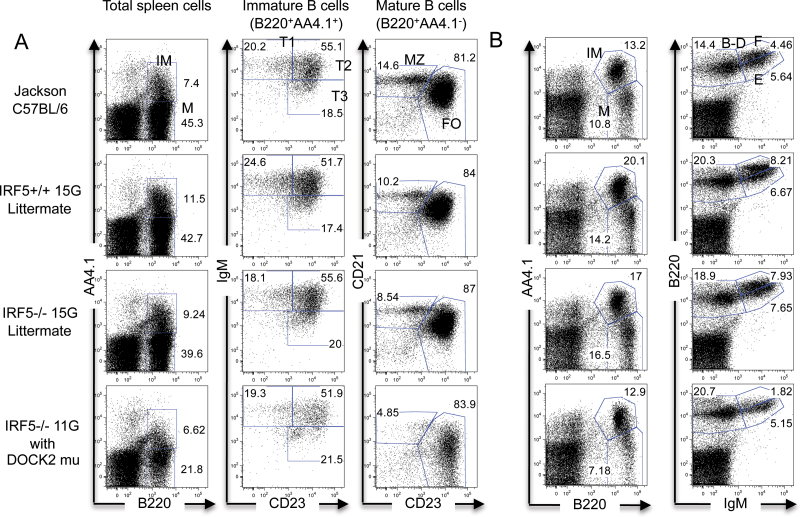
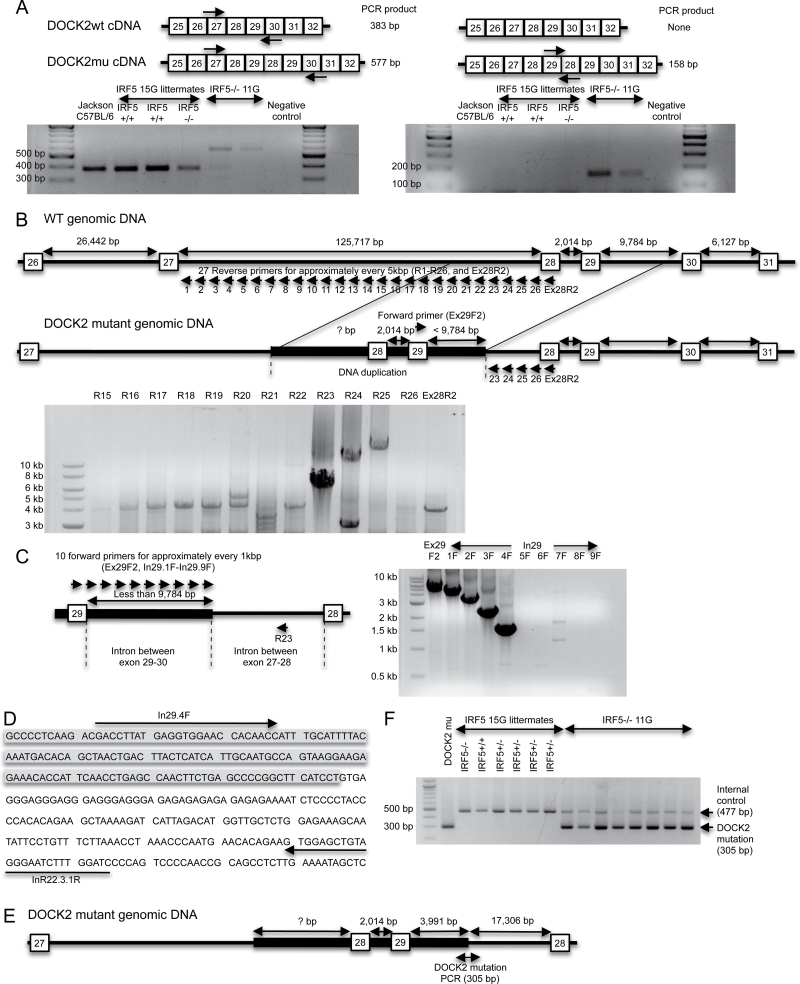
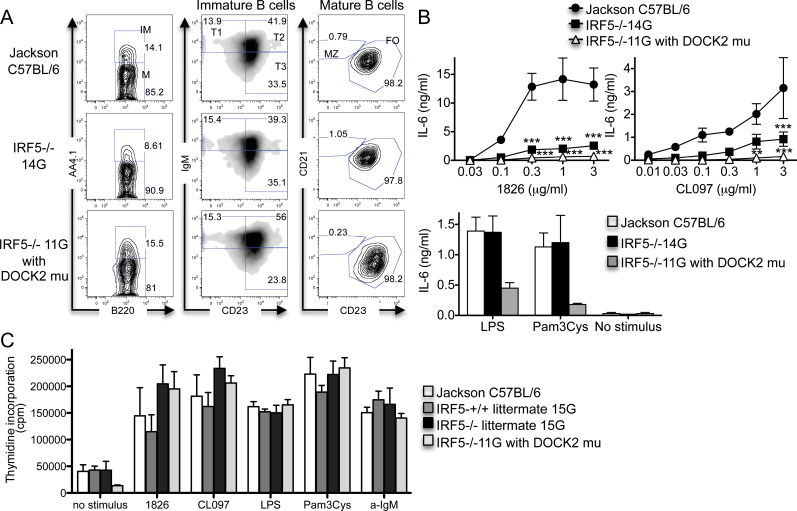
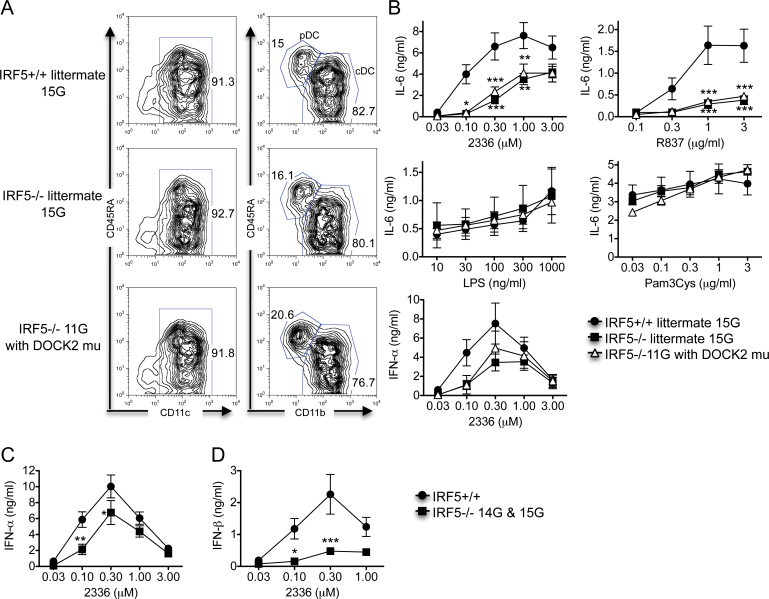
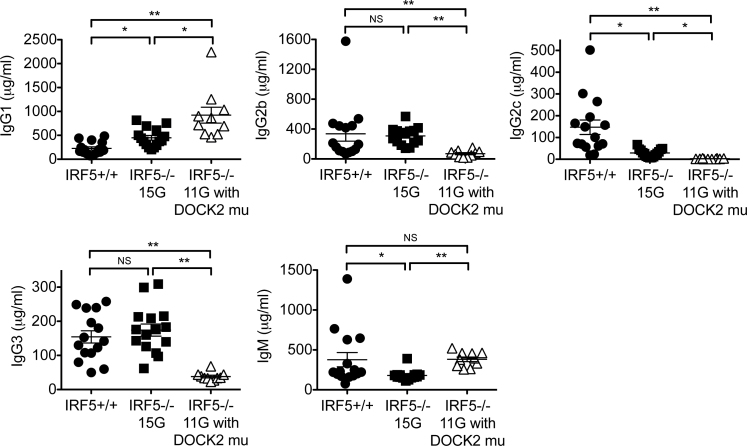
Interferon regulatory factor 5-deficient (IRF5 (-/-) ) mice have been used for many studies of IRF5 biology. A recent report identifies a mutation in dedicator of cytokinesis 2 (DOCK2) as being responsible for the abnormal B-cell development phenotype observed in the IRF5 (-/-) line. Both dedicator of cytokinesis 2 (DOCK2) and IRF5 play important roles in immune cell function, raising the issue of whether immune effects previously associated with IRF5 are due to IRF5 or DOCK2. Here, we defined the insertion end-point of the DOCK2 mutation and designed a novel PCR to detect the mutation in genomic DNA. We confirmed the association of the DOCK2 mutation and the abnormal B-cell phenotype in our IRF5 (-/-) line and also established another IRF5 (-/-) line without the DOCK2 mutation. These two lines were used to compare the role of IRF5 in dendritic cells (DCs) and B cells in the presence or absence of the DOCK2 mutation. IRF5 deficiency reduces IFN-α, IFN-β and IL-6 production by Toll-like receptor 9 (TLR9)- and TLR7-stimulated DCs and reduces TLR7- and TLR9-induced IL-6 production by B cells to a similar extent in the two lines. Importantly however, IRF5 (-/-) mice with the DOCK2 mutation have higher serum levels of IgG1 and lower levels of IgG2b, IgG2a/c and IgG3 than IRF5 (-/-) mice without the DOCK2 mutation, suggesting that the DOCK2 mutation confers additional Th2-type effects. Overall, these studies help clarify the function of IRF5 in B cells and DCs in the absence of the DOCK2 mutation. In addition, the PCR described will be useful for other investigators using the IRF5 (-/-) mouse line.


Figures

Fig. 1.
Fig. 1.
Normal percentages of B-cell populations in the spleen and bone marrow of IRF5 −/− 15G mice. (A) Spleen cells from Jackson C57BL/6 wild-type mice, IRF5 +/+ and IRF5 −/− 15G littermates and IRF5 −/− 11G mice (with the DOCK2 mutation) were stained with antibodies against B220, AA4.1, IgM, CD23 and CD21. Percentages of mature (M) B cells (B220+ AA4.1-) and immature (IM) B cells (B220+ AA4.1+) were determined. Immature B cells were further classified as transitional 1 (T1), T2 or T3 based on IgM and CD23 expression. Mature B cells were further classified as marginal zone (MZ) or follicular (FO) B cells based on CD21 and CD23 expression. The data are representative of three to six independent experiments. (B) Bone marrow cells from the same mice evaluated in (A) were stained with antibodies against B220, AA4.1 and IgM to detect mature B cells (B220+ AA4.1-) and immature, pro-B and pre-B B cells (B220+ AA4.1+) (left-hand panels). The relative percentages of Hardy fractions B-D (pro-B and pre-B; B220+ IgM-), fraction E (immature B; B220intermediate IgM+) and fraction F (mature B; B220high IgM+) were also determined (right-hand panels) (37). The data are representative of three independent experiments.
Fig. 2.
Fig. 2.
A DOCK2 mutation is detected in IRF5 −/− mice backcrossed 11 generations to C57BL/6 (IRF5 −/− 11G) mice but not in IRF5 −/− mice backcrossed 15 generations to C57BL/6 (IRF5 −/− 15G). (A) RT–PCR to detect the DOCK2 mutation (DOCK2mu). RNA was purified from splenic B cells of wild-type C57BL/6 mice from The Jackson Laboratory (Jackson wild-type), IRF5 +/+ and IRF5 −/− 15G littermates and IRF5 −/− 11G mice. RNA was reverse transcribed into cDNA and amplified using specific primers to detect the exon 28–29 duplication as described (31). Primers used in the left-hand gel give a 577-bp product for the DOCK2 mutation and a 383-bp product for wild-type DOCK2. Primers used in the right-hand gel give a 158-bp product for the DOCK2 mutation and do not amplify wild-type DOCK2. (B) The diagram shows the hypothesized differences in genomic DOCK2 DNA between wild-type and DOCK2 mutant IRF5 −/− mice. In the DOCK2 mutant mice, the duplicated exon 28 and 29 together with some flanking DNA is inserted into the intron between exons 27 and 28. The gel shows a PCR performed using a forward primer, which recognizes exon 29 (Ex29F2) and 27 reverse primers (R1-R26 or Ex28R2), which detect the region in the intron between exons 27 and 28 that is closest to exon 28. PCR products were obtained with the R23–R25 primers. IRF5 −/− 11G genomic DNA containing the DOCK2 mutation was used as the template. (C) PCR was performed using the R23 reverse primer and 10 forward primers, which recognize either exon 29 (Ex29F2) or the intron between exons 29 and 30 (In\.1F to In29.9F). (D) DNA sequence of the 3′-end of DOCK2 mutation. The shaded region is the duplicated intronic sequence between exons 29 and 30, and the unshaded region is the non-duplicated intron between exons 27 and 28. (E) Diagram of the DOCK2 mutation. The duplicated segment of the DOCK2 gene present in the DOCK2 mutation ends at 3991bp after exon 29. This duplicated segment is inserted into intron 27–28 at 17 306bp before exon 28. (F) PCR to detect the DOCK2 mutation. Genomic DNA from IRF5 −/− 11G mice gave a PCR product for the DOCK2 mutation (305bp), whereas DNA from IRF5 +/+ and IRF5 −/− 15G littermates did not. CD19 PCR was used as an internal control to verify the adequacy of DNA preparation in each sample.
Fig. 3.
Fig. 3.
Relative contributions of IRF5 and the DOCK2 mutation to B-cell IL-6 production and proliferation. (A and B) B cells were purified from the spleens of Jackson C57BL/6 wild-type mice, IRF5 −/− 14G mice and IRF5 −/− 11G mice (with the DOCK2 mutation) using CD23-positive selection. (A) The B cells were stained with antibodies against B220, AA4.1, IgM, CD21 and CD23. Data are representative of three independent experiments. IM, immature B cells; M, mature B cells; T, transitional B cells; MZ, marginal zone B cells; FO, follicular B cells. (B) B cells were stimulated with LPS (30 µg/ml), Pam3Cys (1 µg/ml), 1826 and CL097 for 48h in the presence of BLyS (50ng/ml). IL-6 levels in the supernatants were measured by ELISA. The data represent the mean ± SEM of three independent experiments. **P < 0.01; ***P < 0.001 versus IRF5+/+. There was no statistical difference between B cells from IRF5 −/− 14G and IRF5 −/− 11G mice. (C) B cells were purified from the spleens of Jackson C57BL/6 wild-type mice (n = 3), IRF5 +/+ (n = 5) and IRF5 −/− (n = 3) 15G littermates, and IRF5 −/− 11G mice (with the DOCK2 mutation) (n =6) using CD23-positive selection. The B cells were stimulated with 1826 (3 µg/ml), CL097 (3 µg/ml), LPS (30 µg/ml), Pam3Cys (1 µg/ml) and anti-IgM antibody (30 µg/ml) for 42h in the presence of BLyS (50ng/ml) and pulsed with 3H thymidine for 6h. The data represent the mean ± SEM of three independent experiments.
Fig. 4.
Fig. 4.
IRF5 is required for TLR7- and TLR9-induced IL-6 and type I interferon production by Flt-3L DCs. (A and B) Bone marrow-derived Flt-3L DCs were prepared from IRF5 +/+ (n = 5) and IRF5 −/− 15G littermates (n = 3) and IRF5 −/− 11G mice (with the DOCK2 mutation) (n = 6). (A) Flt-3L DCs were stained with antibodies to CD11c, CD45RA and CD11b to determine the relative percentages of pDCs (CD11c+, CD45RAhigh and CD11b-) and cDCs (CD11c+, CD45RAlow and CD11b+). The data are representative of three independent experiments. (B) Flt-3L DCs were stimulated with the TLR9 ligand CpG-A (2336), the TLR7 ligand R837, the TLR4 ligand LPS and the TLR2 ligand Pam3Cys for 24h. The levels of IFN-α and IL-6 in the supernatants were measured by ELISA. The data represent the mean ± SEM of three independent experiments. (C and D) Bone marrow-derived Flt-3L DCs were prepared from IRF5+/+ (n = 10; either IRF5+/+ 15G littermates or Jackson C57BL/6) and IRF5−/− (n = 7; either IRF5−/− 15G littermates or IRF5−/− 14G mice). Flt-3L DCs were stimulated with the TLR9 ligand CpG-A (2336) for 24h. The levels of IFN-α (C) and IFN-β (D) in the supernatants were measured by ELISA. The data represent the mean ± SEM of 6–7 independent experiments. *P < 0.05; **P < 0.01; ***P < 0.001 versus IRF5+/+.
Fig. 5.
Fig. 5.
Serum IgG isotype and IgM levels. IgG isotype and IgM levels in the sera of IRF5 +/+ 15G mice (n = 15), IRF5 −/− 15G mice (n = 15) and IRF5 −/− 11G mice with the DOCK2 mutation (n = 10) were measured by ELISA. *P < 0.05; **P< 0.01.

References

    1. Tamura T., Yanai H., Savitsky D., Taniguchi T. 2008. The IRF family transcription factors in immunity and oncogenesis. Annu. Rev. Immunol. 26: 535 - PubMed
    1. Paun A., Pitha P. M. 2007. The IRF family, revisited. Biochimie 89: 744 - PMC - PubMed
    1. Barnes B. J., Moore P. A., Pitha P. M. 2001. Virus-specific activation of a novel interferon regulatory factor, IRF-5, results in the induction of distinct interferon alpha genes. J. Biol. Chem. 276: 23382 - PubMed
    1. Barnes B. J., Kellum M. J., Field A. E., Pitha P. M. 2002. Multiple regulatory domains of IRF-5 control activation, cellular localization, and induction of chemokines that mediate recruitment of T lymphocytes. Mol. Cell. Biol. 22: 5721 - PMC - PubMed
    1. Takaoka A., Yanai H., Kondo S., et al. 2005. Integral role of IRF-5 in the gene induction programme activated by Toll-like receptors. Nature 434: 243 - PubMed

Publication types

Substances