. 2013 Feb;27(2):350-65.
doi: 10.1210/me.2012-1265. Epub 2013 Jan 4.

Research resource: nuclear receptors as transcriptome: discriminant and prognostic value in breast cancer

Affiliations

Research resource: nuclear receptors as transcriptome: discriminant and prognostic value in breast cancer

George E O Muscat et al. Mol Endocrinol. 2013 Feb.

Abstract

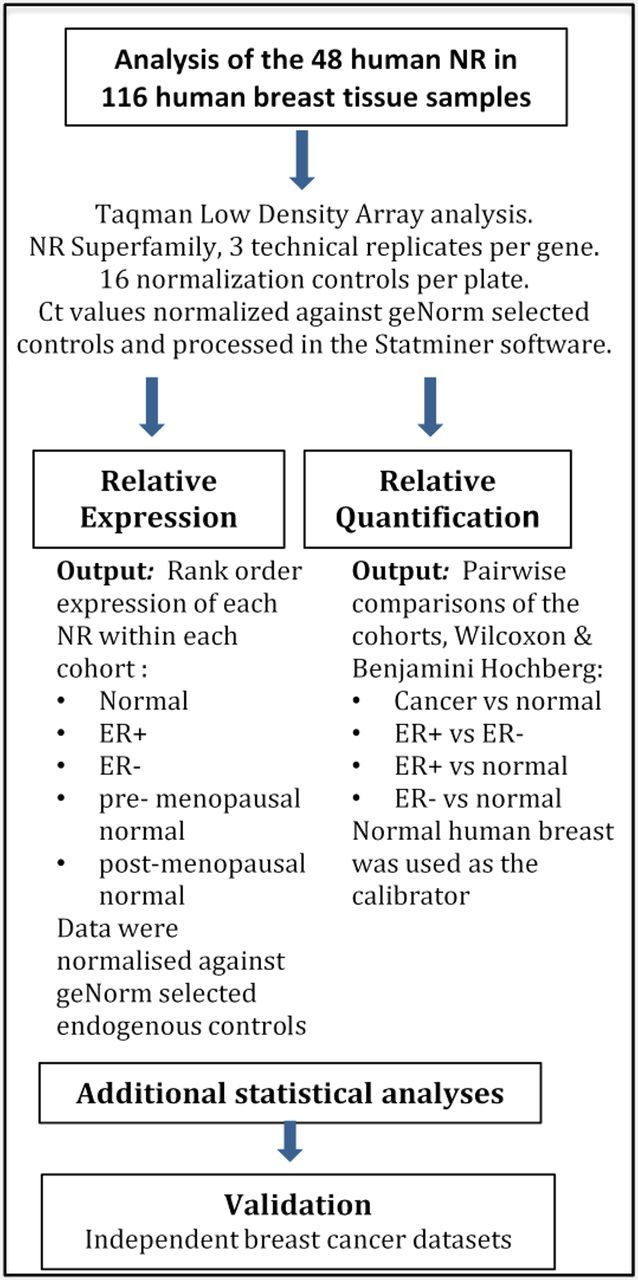
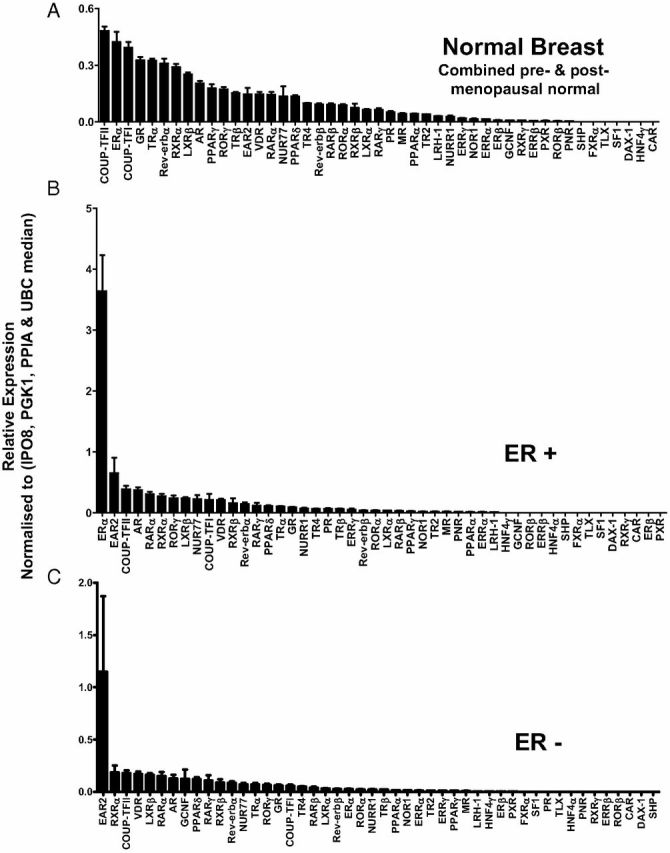
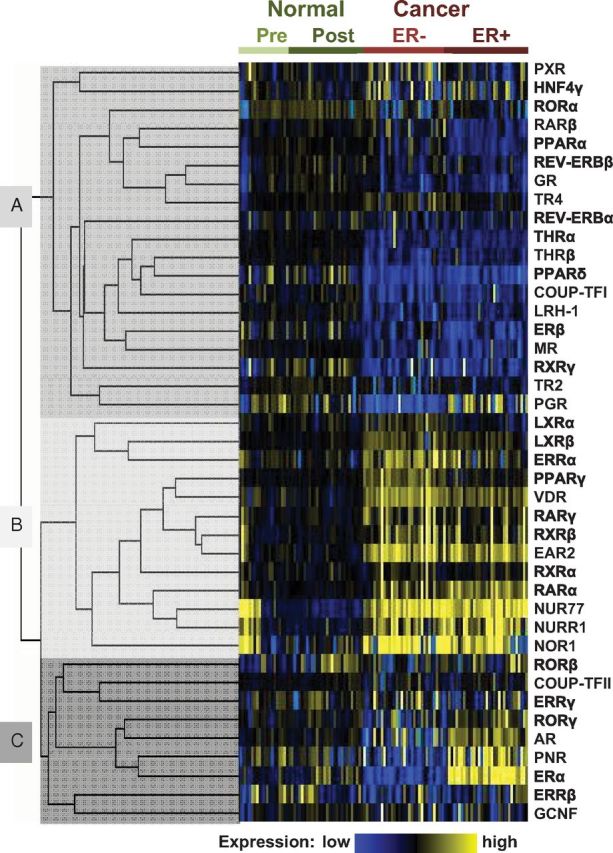
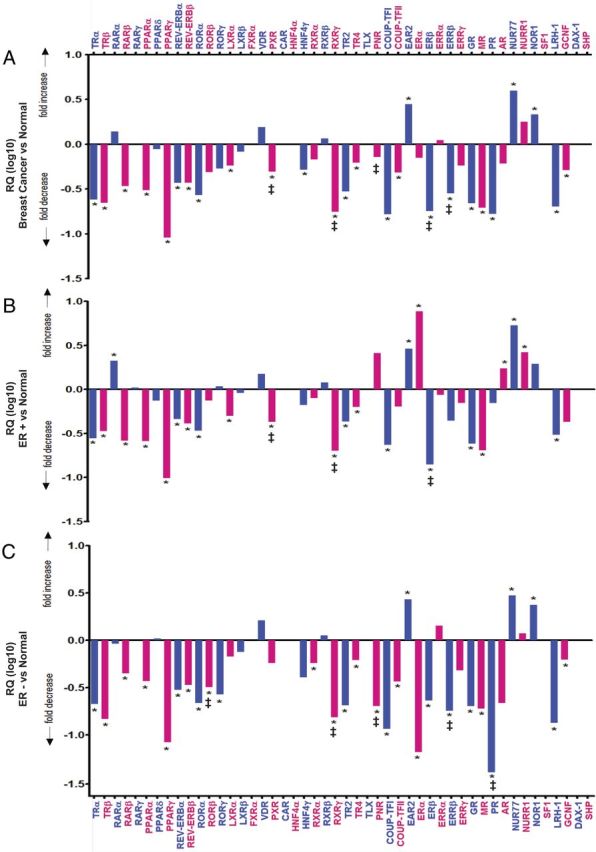
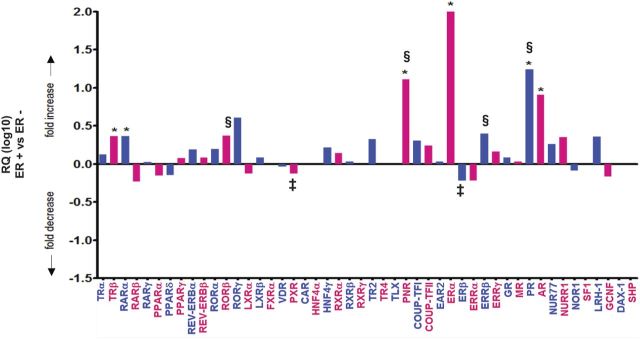
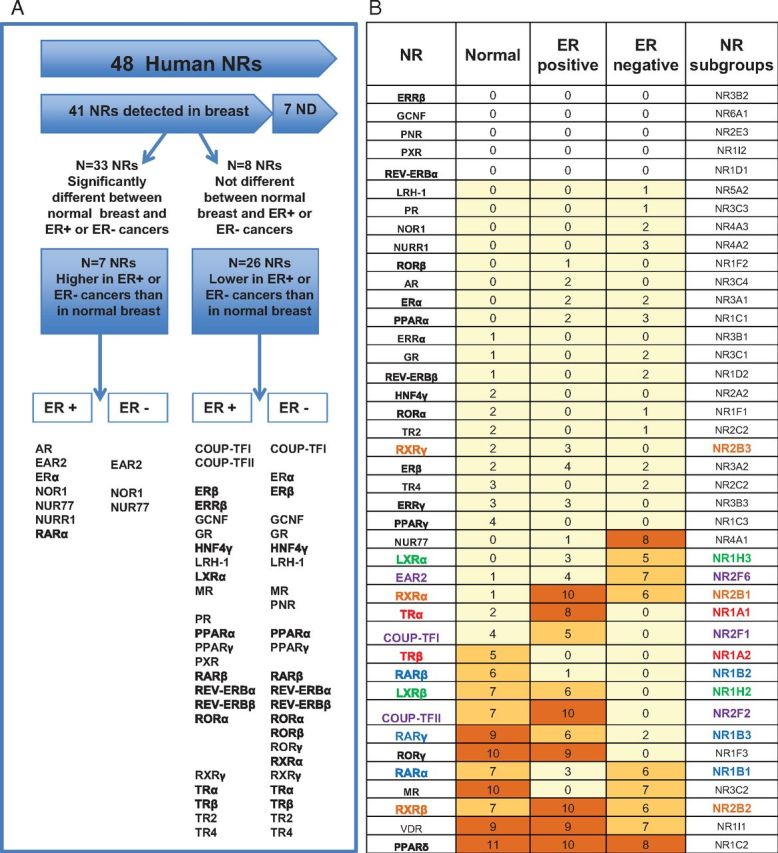
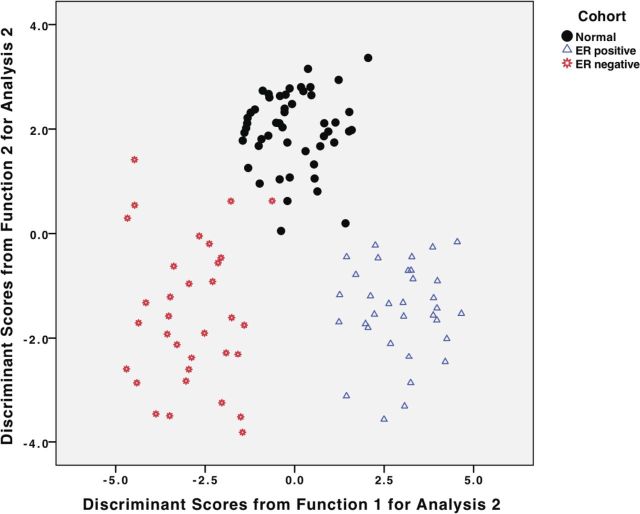
To identify biologically relevant groupings or clusters of nuclear receptors (NR) that are associated with breast neoplasia, with potentially diagnostic, discriminant or prognostic value, we quantitated mRNA expression levels of all 48 members of the human NR superfamily by TaqMan low-density array analysis in 116 curated breast tissue samples, including pre- and postmenopausal normal breast and both ERα(+) and ERα(-) tumor tissue. In addition, we have determined NR levels in independent cohorts of tamoxifen-treated ERα(+) and ERα(-) tissue samples. There were differences in relative NR mRNA expression between neoplastic and normal breast, and between ER(+) and ER(-) tumors. First, there is overexpression of the NUR77 subgroup and EAR2 in neoplastic breast. Second, we identify a signature of five NR (ERα, EAR2, NUR77, TRα, and RARγ) that classifies breast samples with more than 97% cross-validated accuracy into normal or cancer classes. Third, we find a novel negative association between five NR (TRβ, NUR77, RORγ, COUP-TFII, and LRH1) and histological grade. Finally, four NR (COUP-TFII, TRβ, PPARγ, and MR) are significant predictors of metastasis-free survival in tamoxifen-treated breast cancers, independent of ER expression. The present study highlights the discriminant and prognostic value of NR in breast cancer; identifies novel, clinically relevant, NR signatures; and highlights NR signaling pathways with potential roles in breast cancer pathophysiology and as new therapeutic targets.


Figures

Fig. 1.
Fig. 1.
Schematic depiction of the research plan used to analyze 1) the NR expression profiles in normal breast and ER+ and ER cohorts and 2) the fold differences in NR expression in the ER+ and ER cohorts relative to the (combined) normal cohort.
Fig. 2.
Fig. 2.
Rank order relative expression (relative expression of NR in each cohort). Data are presented as the relative expression of NR mRNA normalized to the median of the geNorm controls (IPO8, PGK1, PPIA, and UBC). A, Normal breast (combined pre- and postmenopausal normal breast); B, ER+ breast cancers; C, ER breast cancers.
Fig. 3.
Fig. 3.
Supervised cluster analysis of NR expression in breast cohorts. The relative expression of NR in normal breast and breast cancer cases, determined by qRT-PCR, was compared by supervised hierarchical clustering analysis using GenePattern (40). The analysis was supervised on cases, and relative expression levels of NR were clustered using a Pearson correlation. Data were median centered both on cases and NR. The resulting clusters were visualized as a heat map, using MapleTree (http://rana.lbl.gov/EisenSoftware.htm), where yellow shading represents NR expression greater than the median and blue represents expression below the median. NR grouped into three major clusters: cluster A contained NR expressed at a lower level in cancer than in normal tissue, cluster B was characterized by NR more highly expressed in malignant than normal tissue, and cluster C identified NR that discriminated between ER+ and ER breast cancer.
Fig. 4.
Fig. 4.
A–C, StatMiner analysis of breast cancer (ER+ and ER, n = 66) (A), ER+ breast cancer (n =33) (B), and ER breast cancer (n =33) (C) relative to the calibrator/reference normal (pre- and postmenopausal) breast (n =50). Data are presented as relative quantification (log10), i.e. the calculated fold differences with normal breast as the reference/calibrator normalized to the median of the most stable geNorm (embedded within the Statminer version 4.2 suite) selected controls (IPO8, PGK1, PPIA, and UBC) (selected from the 16 controls assayed on the TLDA) with the least expression variation. Differentially expressed genes were identified by the comparative Ct method, and significance was assigned by the nonparametric Wilcoxon (Mann-Whitney U) test (8) embedded in the Integromics StatMiner software suite. Benjamini-Hochberg FDR correction was used to conservatively filter data, adjust P values, and control for false positives (7, 9). Significance was assigned as P < 0.001 after Benjamini-Hochberg FDR. Relative quantification, i.e. the calculated fold differences [between the target (cancer) and the calibrator/reference sample (normal)] are displayed as valid, when the Ct values of the gene in the target and calibrator/reference samples are below 35 cycles. Fold differences are flagged as target not detected (‡), calibrator not detected (§), and no detection (i.e. expression in either tissue), when the Ct value of the genes in 50% or more of the target, calibrator, and/or both tissues/samples, respectively, are over 35 cycles (the arbitrarily selected threshold limit). NRs (FXRα, CAR, HNF4α, RXRβ, TLX, SF1, DAX-1, and SHP) that were analyzed and denoted as not detected (i.e. Ct value > 35 in cancer and normal breast) have been removed. Alternating blue and pink columns and text are used for clarity and alignment purposes.
Fig. 5.
Fig. 5.
StatMiner analysis of ER-positive breast cancer (n = 33) relative to the calibrator/reference ER breast cancer (n = 33). Data are presented as relative quantification (log10), i.e. the calculated fold differences with ER breast cancer as the reference/calibrator normalized to the median of the most stable geNorm (embedded within the StatMiner version 4.2 suite) selected controls (IPO8, PGK1, PPIA, and UBC), fold differences are flagged as target not detected (‡), calibrator not detected (§), and no detection (i.e. expression in either tissue) as described for Fig. 4. NR (FXRα, CAR, HNF4α, RXRγ, TLX, SF1, DAX-1, and SHP) that were analyzed and denoted as not detected (i.e. Ct value > 35 in ER+ and ER breast cancer) have been removed.
Fig. 6.
Fig. 6.
A, Summary of the distribution of the expression of NR in normal breast and the breast cancer. B, Association between the expression of NR in the breast. The table lists all detected NR and their number of significant associations to all other NR in the normal breast and breast cancer cohorts. Colored shading highlights the number of significant associations: yellow, one to five associations, medium orange, five to seven, and dark orange, eight or more associations. NR from subfamilies overrepresented in the group of NR with the highest associations are colored according to subfamily: red, NR1A, blue, NR1B, green, NR1H, orange, NR2B, purple, NR2F. Significant associations had Spearman rank correlation coefficients greater than or equal to 0.6 (normal cohort) or 0.65 (cancer cohorts), and P values < 0.00006. These associations are summarized in Supplemental Figs. 2 and 3.
Fig. 7.
Fig. 7.
Discriminant function analysis. The plot demonstrates the classification of all cases into the three clinical cohorts, using the discriminant functions. See Supplemental Table 5, A–C, for complete details.

References

    1. Cuzick J , Sestak I , Baum M , Buzdar A , Howell A , Dowsett M , Forbes JF. 2010. Effect of anastrozole and tamoxifen as adjuvant treatment for early-stage breast cancer: 10-year analysis of the ATAC trial. Lancet Oncol 11:1135–1141 - PubMed
    1. Arteaga CL , Sliwkowski MX , Osborne CK , Perez EA , Puglisi F , Gianni L. 2012. Treatment of HER2-positive breast cancer: current status and future perspectives. Nat Rev Clin Oncol 9:16–32 - PubMed
    1. Conzen SD. 2008. Nuclear receptors and breast cancer. Mol Endocrinol 22:2215–2228 - PMC - PubMed
    1. Riggins RB , Mazzotta MM , Maniya OZ , Clarke R. 2010. Orphan nuclear receptors in breast cancer pathogenesis and therapeutic response. Endocr Relat Cancer 17:R213–R231 - PMC - PubMed
    1. Bookout AL , Jeong Y , Downes M , Yu RT , Evans RM , Mangelsdorf DJ. 2006. Anatomical profiling of nuclear receptor expression reveals a hierarchical transcriptional network. Cell 126:789–799 - PMC - PubMed

Publication types

MeSH terms