. 2013 Feb 14;494(7436):256-60.
doi: 10.1038/nature11808. Epub 2013 Jan 6.

Biguanides suppress hepatic glucagon signalling by decreasing production of cyclic AMP

Affiliations

Biguanides suppress hepatic glucagon signalling by decreasing production of cyclic AMP

Russell A Miller et al. Nature. .

Abstract

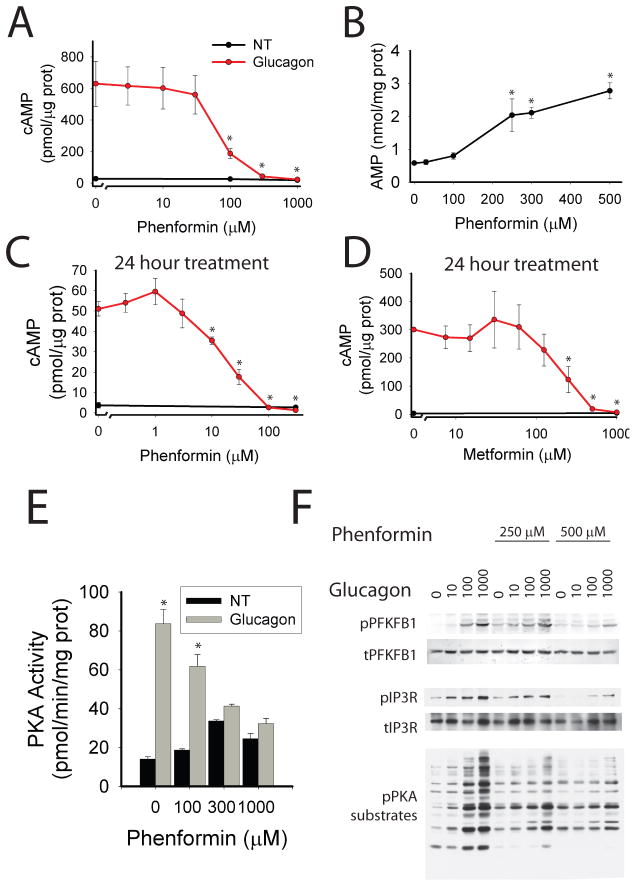
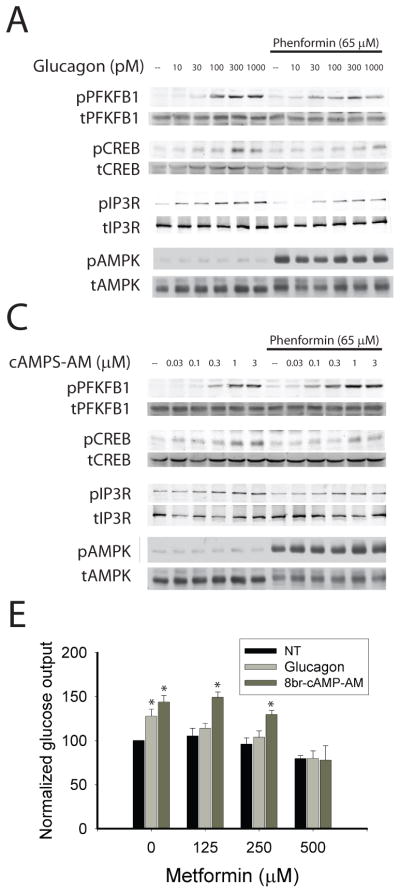
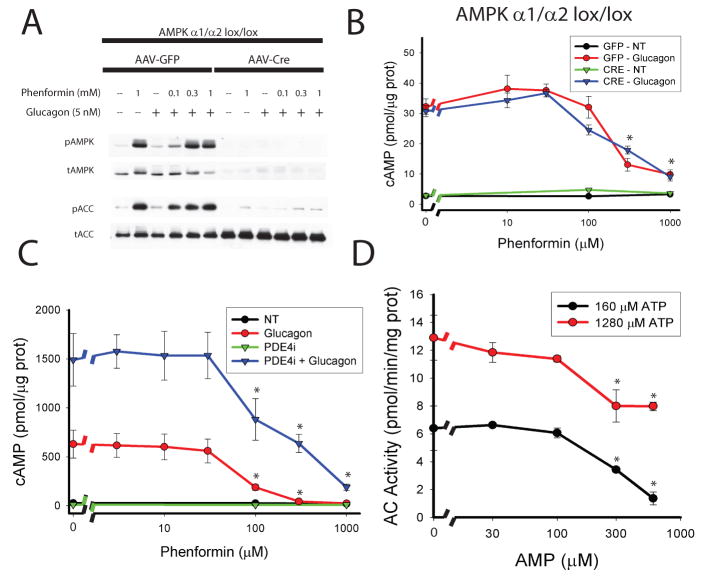
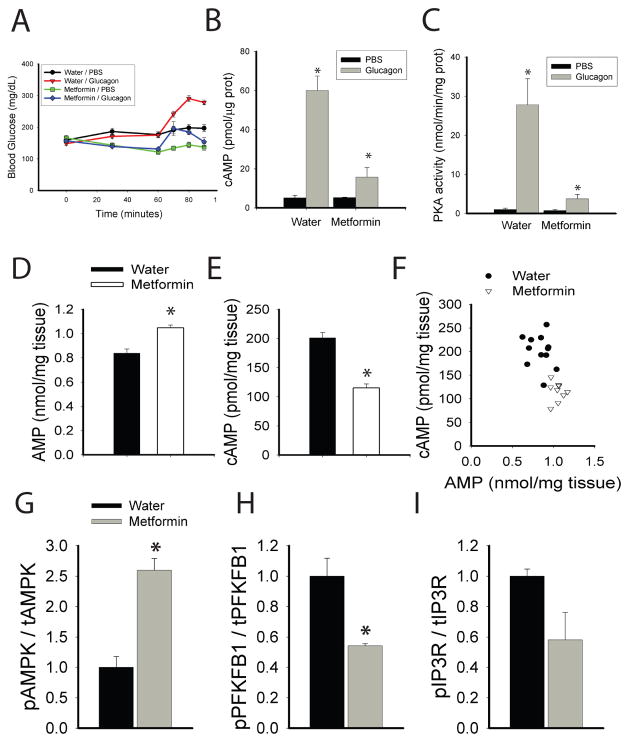
Glucose production by the liver is essential for providing a substrate for the brain during fasting. The inability of insulin to suppress hepatic glucose output is a major aetiological factor in the hyperglycaemia of type-2 diabetes mellitus and other diseases of insulin resistance. For fifty years, one of the few classes of therapeutics effective in reducing glucose production has been the biguanides, which include phenformin and metformin, the latter the most frequently prescribed drug for type-2 diabetes. Nonetheless, the mechanism of action of biguanides remains imperfectly understood. The suggestion a decade ago that metformin reduces glucose synthesis through activation of the enzyme AMP-activated protein kinase (AMPK) has recently been challenged by genetic loss-of-function experiments. Here we provide a novel mechanism by which metformin antagonizes the action of glucagon, thus reducing fasting glucose levels. In mouse hepatocytes, metformin leads to the accumulation of AMP and related nucleotides, which inhibit adenylate cyclase, reduce levels of cyclic AMP and protein kinase A (PKA) activity, abrogate phosphorylation of critical protein targets of PKA, and block glucagon-dependent glucose output from hepatocytes. These data support a mechanism of action for metformin involving antagonism of glucagon, and suggest an approach for the development of antidiabetic drugs.


Figures

Figure 1
Figure 1. Biguanides inhibit cAMP production
A. Primary hepatocytes were incubated with the indicated phenformin concentrations for 2 hours, 5 nM glucagon for 15 minutes, lysed, and assayed for total cellular cAMP and protein. N=4 for each point. B. Primary hepatocytes incubated with the indicated concentration of phenformin for 2 hours were extracted with perchloric acid and cellular nucleotides quantified by HPLC. N=4 for each point. C–D. Primary hepatocytes were incubated with the indicated concentration of phenformin (C) or metformin (D) for 24 hours, treated with 5 nM glucagon, lysed, and assayed for total cellular cAMP. N=4 for each point. E. Primary hepatocytes were incubated with the indicated concentrations of phenformin for 2 hours, treated with 5 nM glucagon, lysed, and PKA kinase activity determined. N=6 for 0 and 1000 μM phenformin groups, N=4 for 100 and 300 μM phenformin groups. F. Primary hepatocytes were incubated with phenformin for 2 hours, then glucagon, and protein was analyzed by western blot with the phospho-PKA substrate motif antibody, total and phospho-PFKFB1 antibodies, and total and phospho IP3R antibodies. Error bars represent standard error.
Figure 2
Figure 2. Biguanides inhibit glucagon signaling
A–B. Primary hepatocytes were cultured for 18 hours in the presence or absence of 65 μM phenformin and for 15 minutes with the indicated concentrations of glucagon (A) or the cell permeable PKA agonist SP-8Br-cAMPS-AM (B). Western blot analysis of total and phosphorylated PFKFB1, CREB, IP3R, and AMPK. E. Cells were treated with the indicated concentration of metformin and either 1 nM glucagon or 3 μM SP-8Br-cAMPS-AM for 14 hours and then glucose output measured for 5 hours. Data represent the means of three experiments, N=6 for each experiment. Error bars represent standard error.
Figure 3
Figure 3. Mechanism of biguanide effect on cAMP production
A. AMPK α1lox/lox/α2lox/lox mice were infected with AAV-TBG-GFP or AAV-TBG-Cre virus and 14 days later primary hepatocytes were isolated. Cells were treated with the indicated concentrations of phenformin for 2 hours followed by 5 nM glucagon for 15 minutes. A. Total cellular protein was analyzed by western blot for total and phosphorylated T172 AMPK and total and phospho-S79 ACC. B. Hepatocytes were lysed and total cellular cAMP levels were quantified by ELISA. N=4 for all points. C. Primary hepatocytes were incubated with the indicated concentrations of phenformin for 2 hours and 50 μM RO-20-1724 (PDE4i) for the final 30 minutes. Cells were then treated with 5 nM glucagon for 15 minutes, lysed, and total cellular cAMP was assayed. N=4 for all points. D. The membrane fraction of primary hepatocytes was isolated by differential centrifugation and used in assays for Adenylyl Cyclase activity in the presence of the indicated AMP and ATP concentrations, 100 nM glucagon, and 100 μM GTP. N=6 for all points. Error bars represent standard error.
Figure 4
Figure 4. Biguanides antagonize glucagon signaling in vivo
A. Mice were gavaged with 500 mg/kg metformin and 1 hour later injected intraperitoneally with 200 μg/kg glucagon, and glucose levels were measured at the indicated times N=6 for water/pbs and metformin/glucagon, N=7 for water/glucagon and metformin/pbs. B–C. Fed mice were fasted for 1 hour and gavaged with water or 500 mg/kg body weight of metformin. One hour later mice were injected intraperitoneally with 2 mg/kg glucagon, and liver tissue was collected five minutes later. Liver was analyzed for B. total hepatic cAMP by ELISA (N=3 for each group) and C. total hepatic PKA activity (N=7, 8, 6, 7 for water/pbs, water/glucagon, metformin/pbs, metformin/glucagon, respectively). D–F. 18 hour fasted mice were gavaged with water or 250 mg/kg metformin, one hour later liver tissue was collected, and hepatic metabolites were extracted with perchloric acid and total hepatic (D.) AMP and (E.) cAMP levels were assayed. N=12 and 9 for water and metformin groups. G–I. Mice fed a high fat diet for 10 weeks were fasted overnight, gavaged either water or 250 mg/kg metformin and after 1 hour and liver tissue was collected for Western blot analysis of the phosphorylation status of (G.) AMPK, (H.) PFKFB1, and (I.) IP3R. N=3 for each group. Error bars represent standard error.

Comment in

References

    1. DeFronzo RA, Simonson D, Ferrannini E. Hepatic and peripheral insulin resistance: a common feature of type 2 (non-insulin-dependent) and type 1 (insulin-dependent) diabetes mellitus. Diabetologia. 1982;23:313–9. - PubMed
    1. Postic C, Dentin R, Girard J. Role of the liver in the control of carbohydrate and lipid homeostasis. Diabetes Metab. 2004;30:398–408. - PubMed
    1. Nathan DM, et al. Medical management of hyperglycemia in type 2 diabetes: a consensus algorithm for the initiation and adjustment of therapy: a consensus statement of the American Diabetes Association and the European Association for the Study of Diabetes. Diabetes Care. 2009;32:193–203. - PMC - PubMed
    1. Foretz M, Hebrard S, Leclerc J, Zarrinpashneh E, Soty M, Mithieux G, Sakamoto K, Andreelli F, Viollet B. Inhibition of hepatic gluconeogenesis by metformin in the absence of LKB1-AMPK pathway: Role of hepatic energy state. Journal of Clinical Investigation. 2010;120 - PMC - PubMed
    1. Inzucchi SE, et al. Efficacy and metabolic effects of metformin and troglitazone in type II diabetes mellitus. N Engl J Med. 1998;338:867–72. - PubMed

Publication types

MeSH terms