. 2013 Feb;31(2):148-53.
doi: 10.1038/nbt.2468. Epub 2013 Jan 6.

Targeted zwitterionic near-infrared fluorophores for improved optical imaging

Affiliations

Targeted zwitterionic near-infrared fluorophores for improved optical imaging

Hak Soo Choi et al. Nat Biotechnol. 2013 Feb.

Abstract

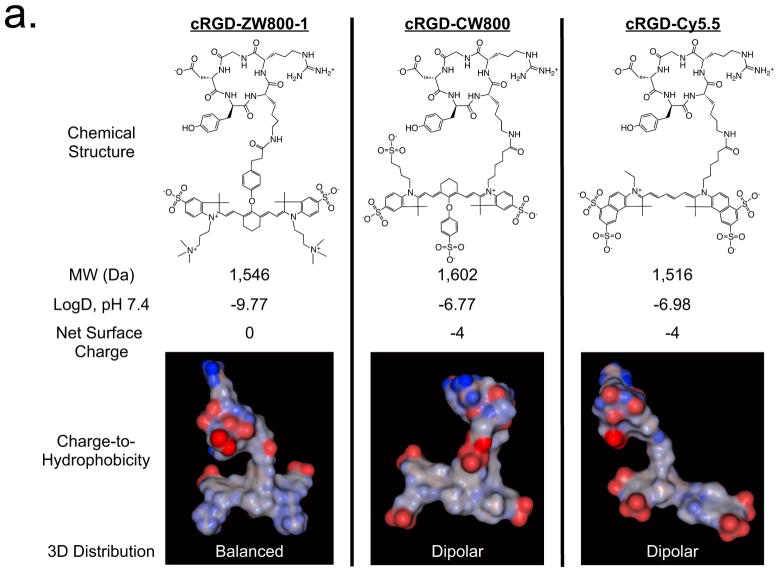
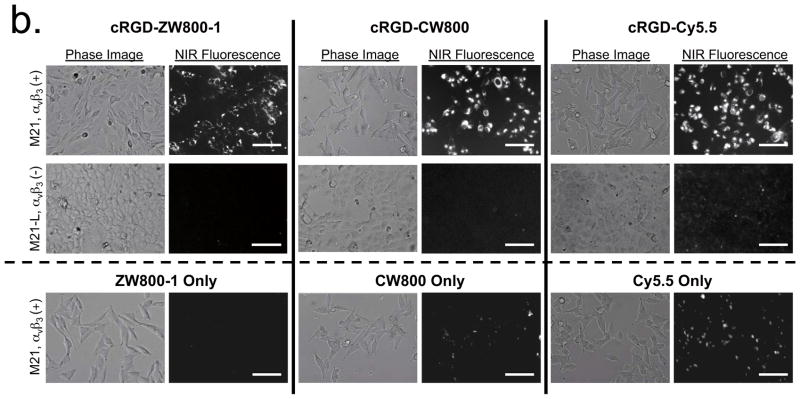
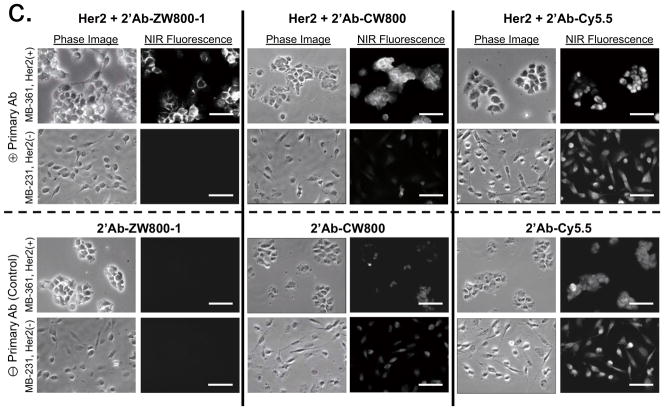
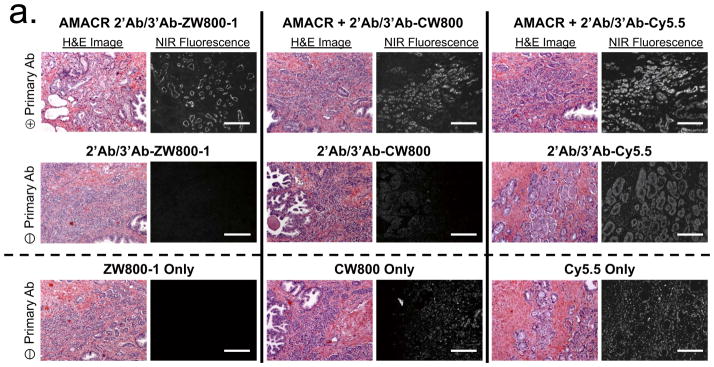
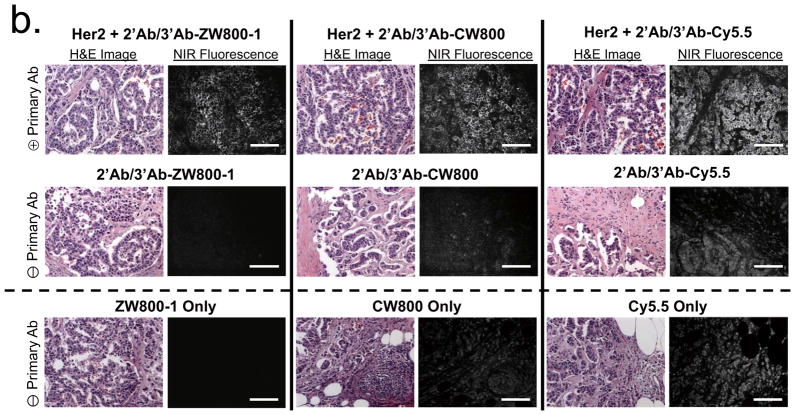
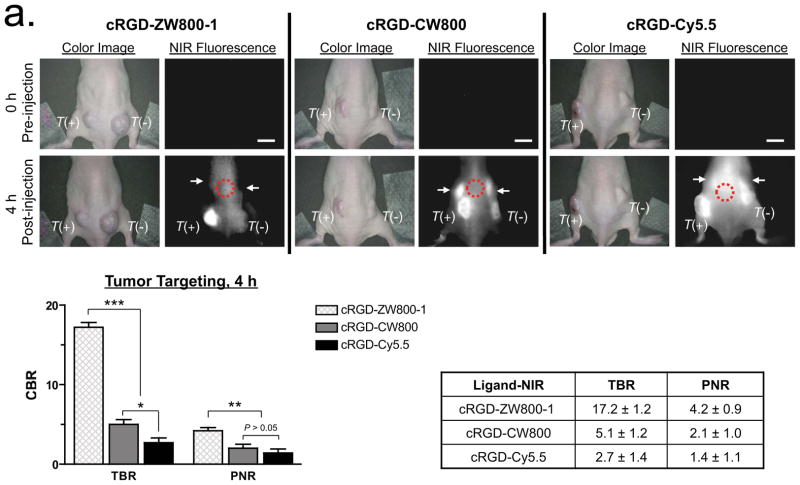
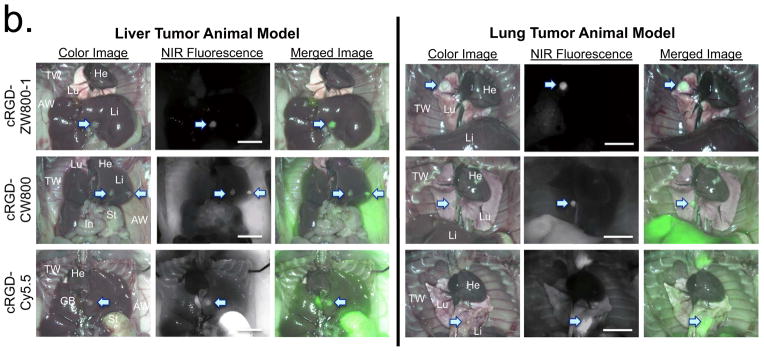
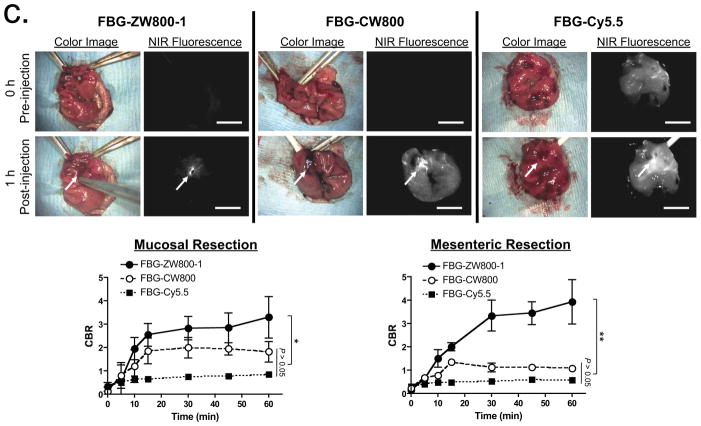
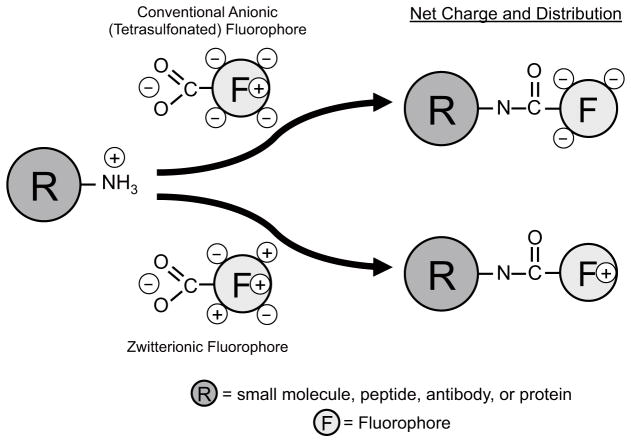
The signal-to-background ratio (SBR) is the key determinant of sensitivity, detectability and linearity in optical imaging. As signal strength is often constrained by fundamental limits, background reduction becomes an important approach for improving the SBR. We recently reported that a zwitterionic near-infrared (NIR) fluorophore, ZW800-1, exhibits low background. Here we show that this fluorophore provides a much-improved SBR when targeted to cancer cells or proteins by conjugation with a cyclic RGD peptide, fibrinogen or antibodies. ZW800-1 outperforms the commercially available NIR fluorophores IRDye800-CW and Cy5.5 in vitro for immunocytometry, histopathology and immunoblotting and in vivo for image-guided surgery. In tumor model systems, a tumor-to-background ratio of 17.2 is achieved at 4 h after injection of ZW800-1 conjugated to cRGD compared to ratios of 5.1 with IRDye800-CW and 2.7 with Cy5.5. Our results suggest that introducing zwitterionic properties into targeted fluorophores may be a general strategy for improving the SBR in diagnostic and therapeutic applications.


Conflict of interest statement

COMPETING FINANCIAL INTERESTS

FLARE technology is owned by Beth Israel Deaconess Medical Center, a teaching hospital of Harvard Medical School. It has been licensed to the FLARE Foundation, a non-profit organization focused on promoting the dissemination of medical imaging technology for research and clinical use. Dr. Frangioni is the founder and chairman of the FLARE Foundation. The Beth Israel Deaconess Medical Center will receive royalties for sale of FLARE Technology. Dr. Frangioni has elected to surrender post-market royalties to which he would otherwise be entitled as inventor, and has elected to donate pre-market proceeds to the FLARE Foundation.

Figures

Figure 1
Figure 1. Targeted NIR fluorophores and improved SBR during cell-based assays
(a) Chemical structure, molecular weight (MW), logD, net surface charge and 3D modeling of the geometrical position of charge and hydrophobicity of cRGD-ZW800-1, cRGD-CW800 and cRGD-Cy5.5 at pH 7.4. Red = negative charge; Blue = positive charge; Gray = hydrophobicity. (b) Live cell binding assay for cRGD-ZW800-1, cRGD-CW800 and cRGD-Cy5.5 (top 2 rows) or NIR fluorophores alone (bottom row) in M21 (αvβ3-positive) and M21-L (αvβ3-negative) melanoma cell lines after incubation with 2 μM of each molecule for 30 min at 37 C. Scale bars = 100 μm. All NIR fluorescence images have identical exposure times and are normalized to peak signal. (c) Antibody binding assay for secondary antibodies conjugated with ZW800-1, CW800 and Cy5.5 in MDA-MB-361 (Her2-positive) and MDA-MB-231 (Her2-negative) human breast cancer cell lines in the presence (top 2 rows) or absence (bottom 2 rows) of the anti-Her2 primary antibody. Scale bars = 50 μm. All NIR fluorescence images have identical exposure times and are normalized to peak signal.
Figure 2
Figure 2. NIR fluorophore-conjugated antibodies and improved SBR during histopathological analysis
(a) H&E (left columns) and NIR fluorescence immunostaining (right columns) of prostate tissue using a rabbit anti-human AMACR primary antibody (top row), goat anti-rabbit secondary and NIR-conjugated mouse anti-goat tertiary antibodies alone (middle row) and NIR fluorophores alone (2 μM each; bottom row). All NIR fluorescence images have identical exposure times and are normalized to peak signal. (b) H&E (left columns) and NIR fluorescence immunostaining (right columns) of breast tissue using a rabbit anti-human Her2 primary antibody (2 row), goat anti-rabbit secondary and NIR-conjugated mouse anti-goat tertiary antibodies alone (middle row) and NIR fluorophores alone (2 μM each; bottom row). All NIR fluorescence images have identical exposure times and are normalized to peak signal. Scale bars = 200 μm.
Figure 3
Figure 3. Improved in vivo optical imaging using zwitterionic, NIR fluorescent, targeted small molecules and proteins
(a) Real-time intraoperative melanoma detection using targeted small molecules. 3 nmol of cRGD-ZW800-1 (left), 3 nmol of cRGD-CW800 (middle), or 10 nmol of cRGD-Cy5.5 (right) was injected intravenously into melanoma tumor mice. Shown are representative (n = 5) images of color and NIR fluorescence immediately pre-injection (0 h) and at 4 h post-injection. T(+) = integrin αvβ3-positive tumor; T(−) = integrin αvβ3-negative tumor; arrows = kidneys; red dotted circle = ROI used for TBR background measurement. Quantitation of image signal and background is also shown at 4 h post-injection. All NIR fluorescence images have identical exposure times and are normalized to peak signal. (b) Real-time intraoperative liver (left) and lung (right) tumor detection using targeted small molecules. 10 nmol of cRGD-ZW800-1 (top), cRGD-CW800 (middle), or cRGD-Cy5.5 (bottom) was injected intravenously into each tumor mouse 4 h prior to imaging. Shown are representative (n = 5) images of color image, NIR fluorescence and a pseudo-colored merge of the two. AW, abdominal wall; GB, gallbladder; He, heart; In, intestine; Li, liver; Lu, lungs; St, stomach; TW, thoracic wall. Arrows = tumors. All NIR fluorescence images have identical exposure times and are normalized to peak signal. (c) Real-time intraoperative thrombus detection using targeted proteins. 40 pmol/g of FBG-ZW800-1 (left), FBG-CW800 (middle), or FBG-Cy5.5 (right) was injected intravenously into SD rats 1 h after mucosal resection (arrows) in the stomach (shown) or mesenteric vessels (Supplementary Fig. 6). CBR (lower graphs) was calculated from the ratio of the signal at the site of injury site versus nearby normal tissue background. Arrows = injury sites. Statistical analysis was performed using one-way ANOVA followed by Tukey’s multiple-comparison test (*P < 0.05; **P < 0.01). All NIR fluorescence images have identical exposure times and are normalized to peak signal. Scale bars = 1 cm.
Figure 4
Figure 4
Modification of a primary amine by commercially available anionic NIR fluorophores (top) and zwitterionic NIR fluorophores (bottom).

Comment in

  • Led to the near infrared.
    Doerr A. Doerr A. Nat Methods. 2013 Mar;10(3):196. doi: 10.1038/nmeth.2394. Nat Methods. 2013. PMID: 23570044 No abstract available.

References

    1. Frangioni JV. In vivo near-infrared fluorescence imaging. Curr Opin Chem Biol. 2003;7:626–634. - PubMed
    1. Gioux S, Choi HS, Frangioni JV. Image-guided surgery using invisible near-infrared light: fundamentals of clinical translation. Mol Imaging. 2010;9:237–255. - PMC - PubMed
    1. Te Velde EA, Veerman T, Subramaniam V, Ruers T. The use of fluorescent dyes and probes in surgical oncology. Eur J Surg Oncol. 2010;36:6–15. - PubMed
    1. Ballou B, et al. Tumor labeling in vivo using cyanine-conjugated monoclonal antibodies. Cancer immunology, immunotherapy : CII. 1995;41:257–263. - PMC - PubMed
    1. Ballou B, et al. Cyanine fluorochrome-labeled antibodies in vivo: assessment of tumor imaging using Cy3, Cy5, Cy5.5, and Cy7. Cancer detection and prevention. 1998;22:251–257. - PubMed

Publication types