

Review
doi: 10.1093/bfgp/els059.
Epub 2013 Jan 4.
Dynamics of the DNA damage response: insights from live-cell imaging
Affiliations
- PMID: 23292635
- PMCID: PMC3609438
- DOI: 10.1093/bfgp/els059
Item in Clipboard
Review
Dynamics of the DNA damage response: insights from live-cell imaging
Brief Funct Genomics.
2013 Mar.
Abstract
All organisms have to safeguard the integrity of their genome to prevent malfunctioning and oncogenic transformation. Sophisticated DNA damage response mechanisms have evolved to detect and repair genomic lesions. With the emergence of live-cell microscopy of individual cells, we now begin to appreciate the complex spatiotemporal kinetics of the DNA damage response and can address the causes and consequences of the heterogeneity in the responses of genetically identical cells. Here, we highlight key discoveries where live-cell imaging has provided unprecedented insights into how cells respond to DNA double-strand breaks and discuss the main challenges and promises in using this technique.
Figures
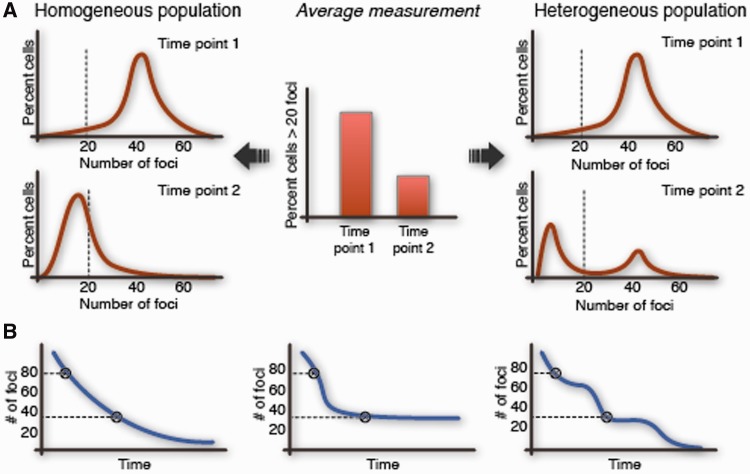
Ensemble measurements can mask the variation in the kinetics of repair between cells. The kinetics of DNA DSB repair are popularly measured by averaging the number of foci in groups of fixed cells at specific times after damage. Such measurements do not capture the natural variation in the population and can mask the true kinetics of repair in single cells. (A) Left—a homogeneous population that repairs rather uniformly and right—a heterogeneous population that exhibits bimodality in the rates of repair; both yield the same average measurements at different times after damage. (B) The decay in the number of foci for three different cells is shown. Each of these cells has unique kinetics of repair, however, would yield the same number of foci if fixed at the indicated times.
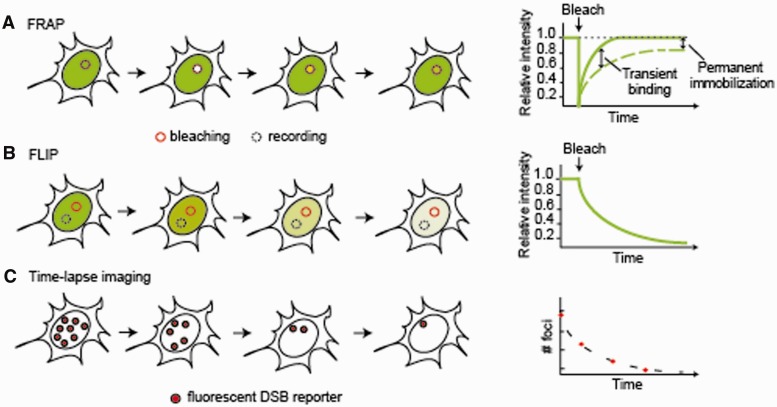
Live-cell imaging techniques for studying DNA repair. (A) FRAP. A region of interest (solid circle) in the nucleus is photobleached with a strong laser pulse and the recovery of fluorescence intensity within the same region is monitored in time. The diffusion of the tagged protein and the kinetics of its binding interactions are measured from the rate of recovery (dashed line) in comparison to an inert protein of similar size (solid line). A delayed FRAP recovery indicates transient binding events and the fraction of recovery reflects the proportion of mobile molecules. In this example, ∼80% of tagged proteins in the bleached region are mobile. (B) FLIP. Bleaching within a region of interest (solid circle) is accompanied by measurement of fluorescence intensity in another region of the nucleus (dashed circle). The fluorescence decay in the recorded region indicates the extent of exchange between the two compartments. (C) Time-lapse microscopy. The expression and localization of the tagged proteins is monitored in time. In this example, the number of repair foci formed by the tagged protein is monitored to measure the rates of repair.
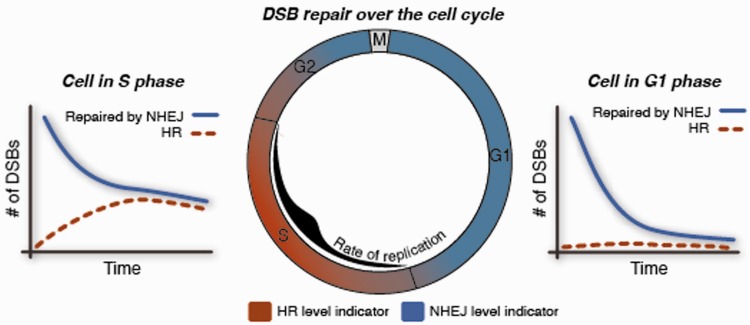
The effect of cell cycle on the balance between alternate repair pathways. Cells that simultaneously expressed fluorescent protein reporters for DNA DSBs, HR and cell cycle were monitored by long-term time-lapse imaging. Analyses of the numbers of HR foci in single cells revealed that G1 cells repair exclusively by the non-homologous end-joining (NHEJ) pathway, while cells in S and G2 phase use both NHEJ and HR for repair. The level of HR changes gradually as cells enter or exit S phase and maximal use of HR occurs in mid-S at the peak of active DNA replication.
References
-
- Lobrich M, Jeggo PA. The impact of a negligent G2/M checkpoint on genomic instability and cancer induction. Nat Rev Cancer. 2007;7:861–9. - PubMed
-
- Kastan MB, Bartek J. Cell-cycle checkpoints and cancer. Nature. 2004;432:316–23. - PubMed
-
- Su TT. Cellular responses to DNA damage: one signal, multiple choices. Ann Rev Genet. 2006;40:187–208. - PubMed
-
- Zhou BB, Elledge SJ. The DNA damage response: putting checkpoints in perspective. Nature. 2000;408:433–9. - PubMed
-
- Harrison JC, Haber JE. Surviving the breakup: the DNA damage checkpoint. Ann Rev Genet. 2006;40:209–35. - PubMed
Publication types
MeSH terms
Grants and funding
LinkOut - more resources
Full Text Sources
Other Literature Sources
