

Review
doi: 10.1002/0471142956.cy0127s63.
Spectral flow cytometry
Affiliations
- PMID: 23292705
- PMCID: PMC3556726
- DOI: 10.1002/0471142956.cy0127s63
Item in Clipboard
Review
Spectral flow cytometry
Curr Protoc Cytom.
2013 Jan.
Abstract
Interest in measuring the complete fluorescence spectra of individual cells in flow can be traced to the earliest days of flow cytometry. Recent advances in detectors, optics, and computation have made it possible to make full spectral measurements in the sub-millisecond time frame in which flow cytometry measurements typically occur. This opens up new possibilities for applying spectroscopy to the analysis of individual cells. This unit reviews historical and contemporary approaches to spectral flow cytometry, as well as instrument design, calibration, and data analysis for spectral flow cytometry applications.
Figures
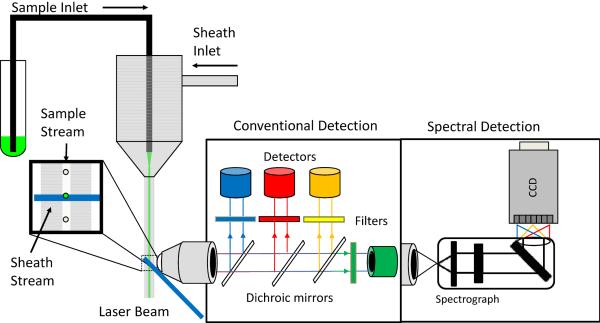
Conventional detection uses dichroic mirrors and bandpass filters to select colors of light for detection on PMTs. Spectral detection uses gratings or prisms to disperse light across a detector array.
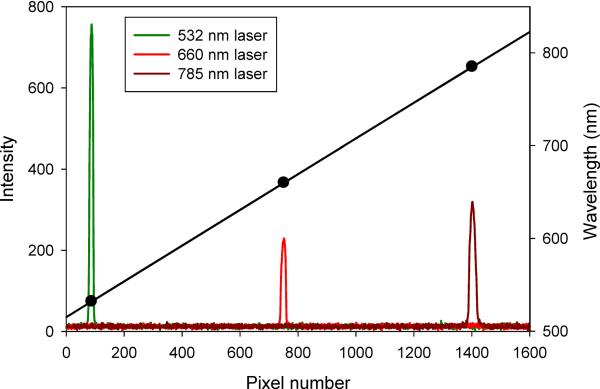
Spectra of three different laser lines taken on a grating spectrograph coupled to a CCD detector.
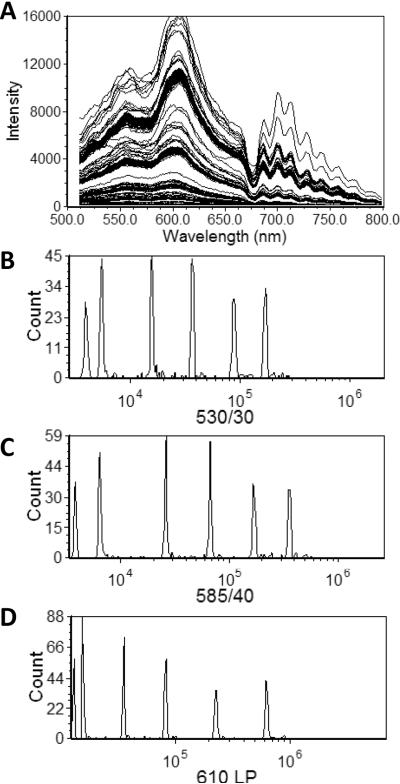
A) Spectral flow cytometry data from multifluorphore beads (UltraRainbow, Spherotech). Intensity histograms generated by applying virtual bandpass filters: B) 530/30 C) 585/40, D) 610 LP.
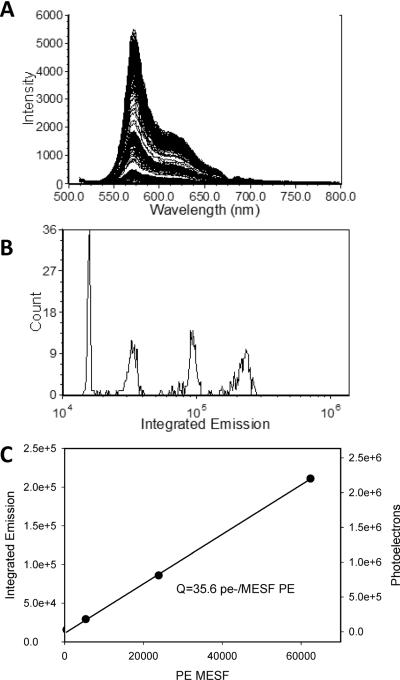
A) Spectral flow cytometry data of PE calibration beads (PE Quantibrite, BD Biosciences). B) Histogram of Integrated Emission intensity for the calibration bead set. C) plot of calibration bead MESF value vs Integrated Intensity and the number of photons detected, as calculated from the detector response.
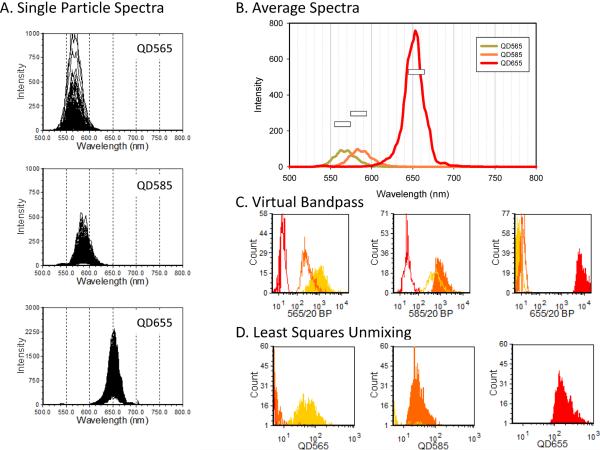
Biotinylated beads labeled with different streptavidin QDots were analyze by spectral flow cytometry. A) Spectra of individual beads B) average particle spectra for each QDot. C) Contribution of each QDot as estimated using band pass filters. D) Contribution of each QDot as estimated using CLS spectral unmixing.
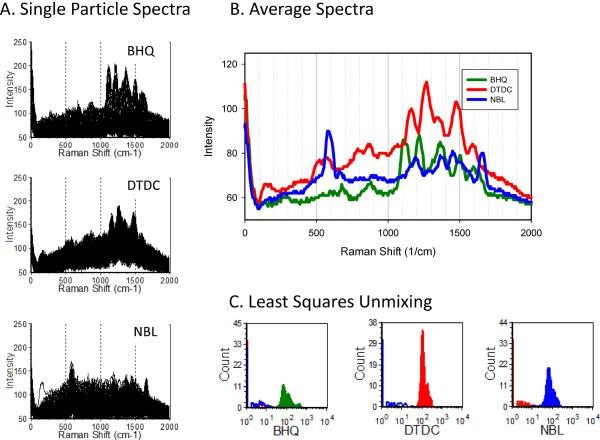
Avidin-coated beads labeled with different biotinylated SERS tags were analyze by spectral flow cytometry. A) Spectra of individual beads B) average particle spectra for each SERS tag. C) Contribution of each SERS tag as estimated using CLS spectral unmixing.
References
-
- Alberti S, Parks DR, Herzenberg LA. A single laser method for subtraction of cell autofluorescence in flow cytometry. Cytometry. 1987;8:114–119. - PubMed
-
- Asbury CL, Esposito R, Farmer C, van den Engh G. Fluorescence spectra of DNA dyes measured in a flow cytometer. Cytometry. 1996;24:234–242. - PubMed
-
- Buican TN. Real-time Fourier transform spectrometry for fluorescence imaging and flow cytometry. 1990:126.
-
- Chase ES, Hoffman RA. Resolution of dimly fluorescent particles: A practical measure of fluorescence sensitivity. Cytometry. 1998;33:267–279. - PubMed
Publication types
MeSH terms
Grants and funding
LinkOut - more resources
Full Text Sources
Other Literature Sources
