. 2013 Jan 22;110(4):1209-14.
doi: 10.1073/pnas.1216073110. Epub 2013 Jan 4.

Relationship between sea level and climate forcing by CO2 on geological timescales

Affiliations

Relationship between sea level and climate forcing by CO2 on geological timescales

Gavin L Foster et al. Proc Natl Acad Sci U S A. .

Abstract

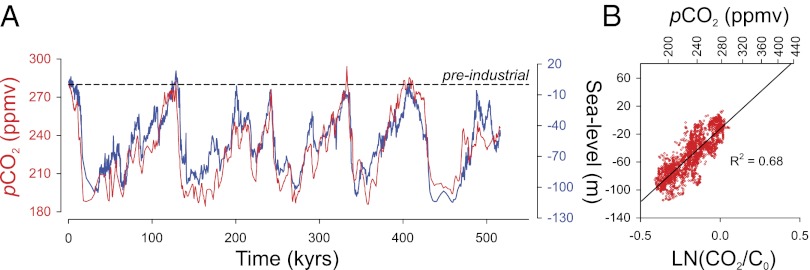
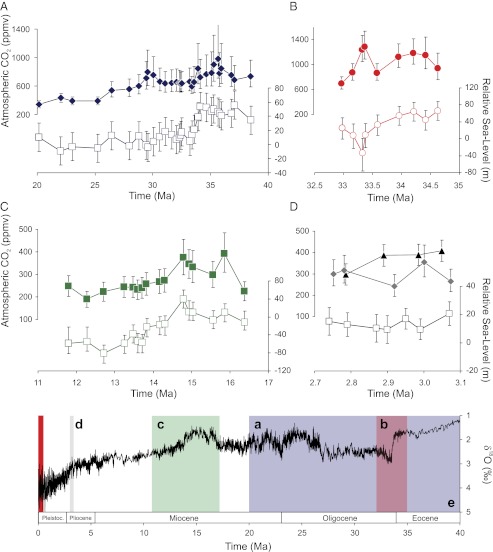
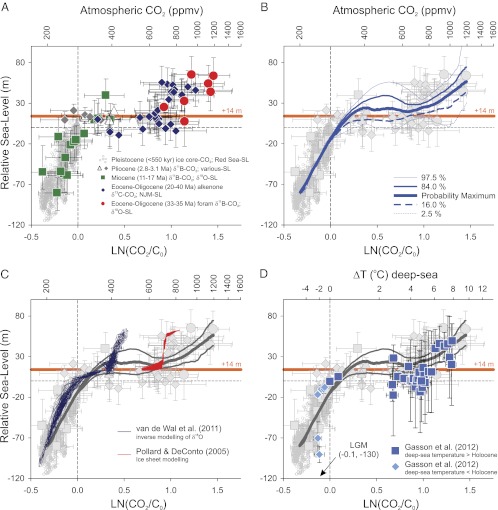
On 10(3)- to 10(6)-year timescales, global sea level is determined largely by the volume of ice stored on land, which in turn largely reflects the thermal state of the Earth system. Here we use observations from five well-studied time slices covering the last 40 My to identify a well-defined and clearly sigmoidal relationship between atmospheric CO(2) and sea level on geological (near-equilibrium) timescales. This strongly supports the dominant role of CO(2) in determining Earth's climate on these timescales and suggests that other variables that influence long-term global climate (e.g., topography, ocean circulation) play a secondary role. The relationship between CO(2) and sea level we describe portrays the "likely" (68% probability) long-term sea-level response after Earth system adjustment over many centuries. Because it appears largely independent of other boundary condition changes, it also may provide useful long-range predictions of future sea level. For instance, with CO(2) stabilized at 400-450 ppm (as required for the frequently quoted "acceptable warming" of 2 °C), or even at AD 2011 levels of 392 ppm, we infer a likely (68% confidence) long-term sea-level rise of more than 9 m above the present. Therefore, our results imply that to avoid significantly elevated sea level in the long term, atmospheric CO(2) should be reduced to levels similar to those of preindustrial times.


Conflict of interest statement

The authors declare no conflict of interest.

Figures

Fig. 1.
Fig. 1.
The relationship between the partial pressure of atmospheric CO2 (ppmv) and global sea level (m). (A) The record of CO2 and sea level over the past 550,000 y (–9). The dotted horizontal line denotes preindustrial values for each variable. (B) Cross-plot of pCO2 [and ln(CO2/C0)] against sea level (m) for the same data shown in A. A linear best-fit line is shown with an R2 (correlation coefficient) = 0.68.
Fig. 2.
Fig. 2.
Time series of sea-level and CO2 data used to construct Fig. 3. (A) Alkenone δ13C based CO2 (13) and sea level based on sequence stratigraphy of the NJM (27). (B) Boron isotope-based CO2 record (15) with sea level based on the oxygen isotope composition of planktic foraminifera fixed at ice-free (e.g., pre-Eocene–Oligocene boundary) = + 65 m (SI CO2 and Sea-Level Estimates). (C) Boron isotope-based CO2 record (18) with sea level from the benthic foraminiferal δ18O (45) fixed to the Miocene highstand of the NJM sequence stratigraphic record (28) (SI CO2 and Sea-Level Estimates). (D) Boron isotope-based CO2 records (gray diamonds) (17) and (black triangles) (16). Sea-level record from a compilation (26) using several methodologies, including sequence stratigraphy and benthic foraminiferal δ18O corrected for temperature (see ref. for details). Note CO2 and highstands do not correlate exactly in time, but in each case sea-level estimate and CO2 are within 10,000 y. (E) Benthic oxygen isotope stack (30) with the locations of the time slices shown in AD (and Fig. 1), shown as appropriately colored and labeled band. All data displayed in (AD) can be found in Dataset S1.
Fig. 3.
Fig. 3.
Cross-plot of estimates of atmospheric CO2 and coinciding sea level. (A) Data are split according to time period and technique used. Symbols as in Fig. 2. Note for the Eocene–Oligocene from δ11B and δ18O, only data that form a decreasing CO2 trend are plotted for clarity. (B) Results from our probabilistic analysis of the data that fully accounts for uncertainty in both X and Y parameters (see text; Dataset S2). (C) Data shown in Fig. 3A along with EAIS ice-sheet model output (37) for declining CO2 with orbital variation (red) and the results of inverse modeling of δ18O (blue) (39). (D) Relative deep-sea temperature change (ΔDST; second x-axis) and sea-level compilation (blue) (40). ΔDST has been scaled by assuming (i) for ΔDST > 0, ΔDST = global temperature change (ΔTglobal), when ΔDST < 0, ΔDST = ΔTglobal/1.5 (following ref. 46); and (ii) for a ΔDST > 0 climate sensitivity of 2.96 K per CO2 doubling (4), for a ΔDST < 0 a climate sensitivity of 11.5 K per CO2 doubling (4). The last glacial maximum (LGM) datapoint from ref. lies outside this plot at −0.1 ± 0.1, −130 ± 10 m (indicated by arrow). On all panels, dotted lines denote the preindustrial conditions of 0 m and 280 ppm CO2. The horizontal orange line shows +14 m, which is the sea-level rise associated with the total melting of WAIS and GrIS (31). For C and D, the least-squares spline fit through the data (thick gray lines) is shown only as a probability maximum and 84 and 16 percentiles for clarity.

References

    1. Meehl GA, et al. Relative outcomes of climate change mitigation related to global temperature versus sea-level rise. Nature Climate Change. 2012;2:576–580.
    1. Rignot E, Velicogna I, van de Broeke MR, Monaghan A, Lenaerts JTM. Acceleration of the contribution of the Greenland and Antarctic ice sheets to sea level rise. Geophys Res Lett. 2011;38(L05503) doi: 10.1029/2011GL046583. - DOI
    1. Rohling EJ, Medina-Elizalde M, Sheppard JG, Siddall M, Stanford JD. Sea surface and high-latitude temperature sensitivity to radiative forcing of climate over several glacial cycles. J Clim. 2012;25:1635–1656.
    1. Rohling EJ, Sluijs A, Dijkstra HA, Köhler P; Paleosens Project Members. Making sense of palaeoclimate sensitivity. Nature 491:683–691. - PubMed
    1. Solomon SD, et al., editors. Contribution of Working Group 1 to the Fourth Assessment Report of the Intergovernmental Panel on Climate Change; The Physical Science Basis. Cambridge, UK: Cambridge Univ Press; 2007. p. 996.

Publication types

LinkOut - more resources