. 2013 Jan 22;110(4):1398-403.
doi: 10.1073/pnas.1205299110. Epub 2013 Jan 4.

Genetic heterogeneity of diffuse large B-cell lymphoma

Affiliations

Genetic heterogeneity of diffuse large B-cell lymphoma

Jenny Zhang et al. Proc Natl Acad Sci U S A. .

Abstract

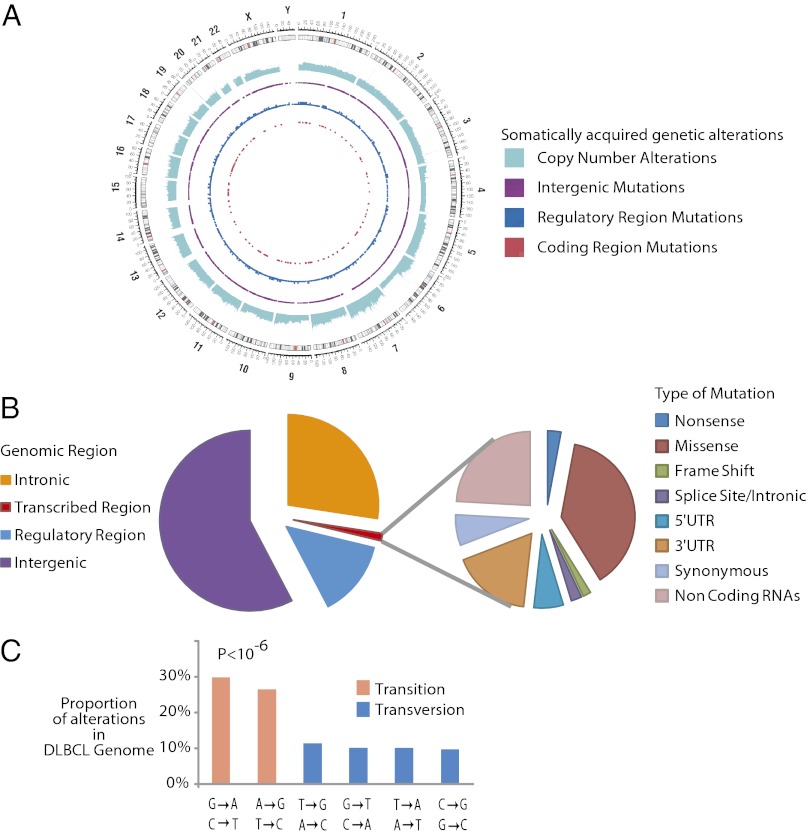
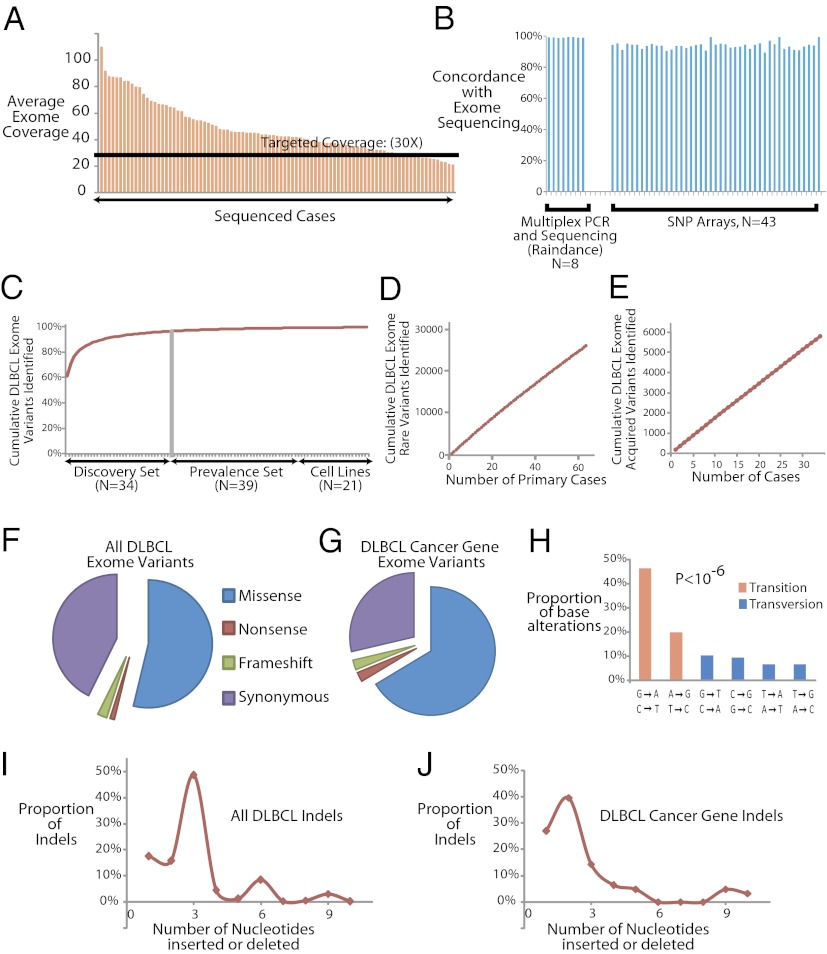
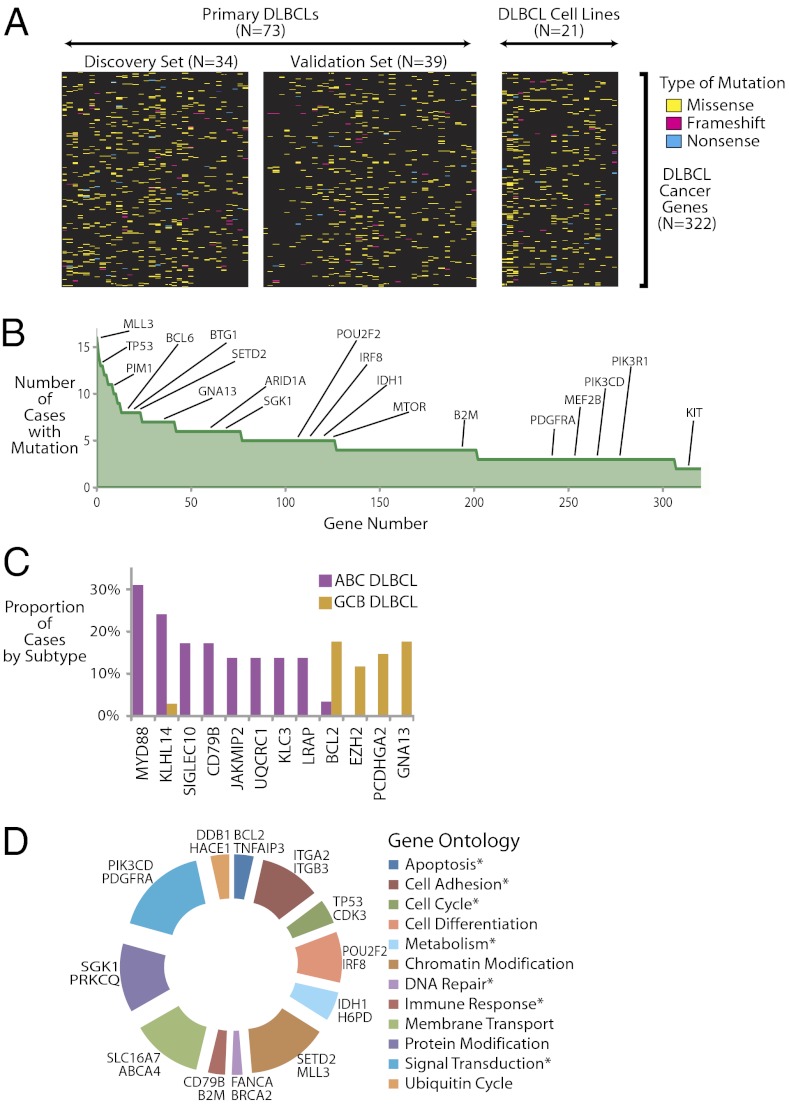
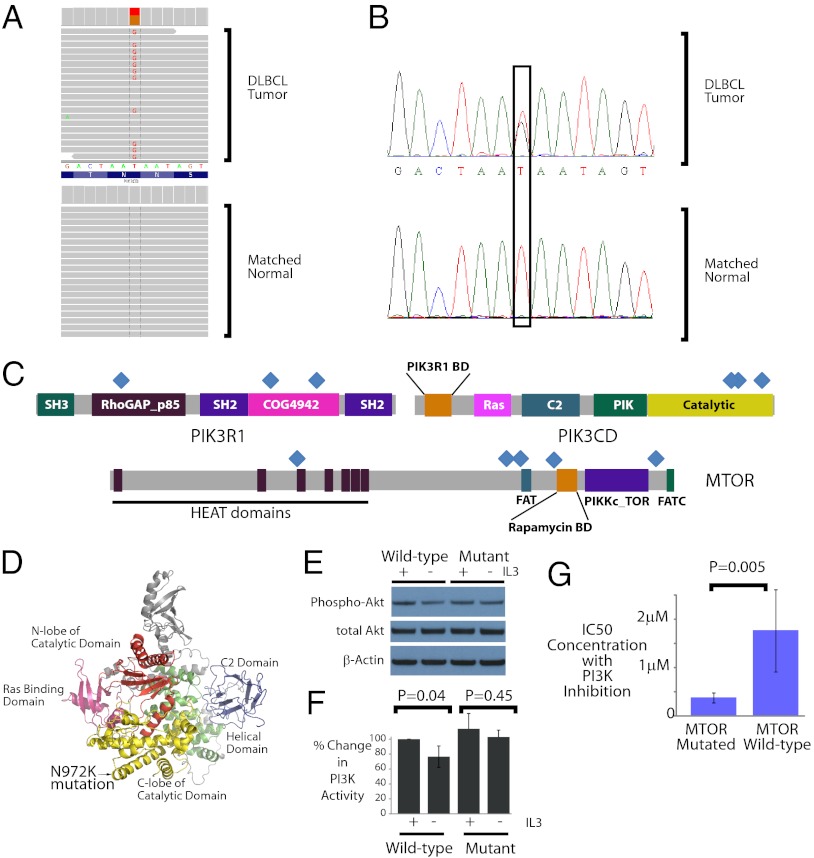
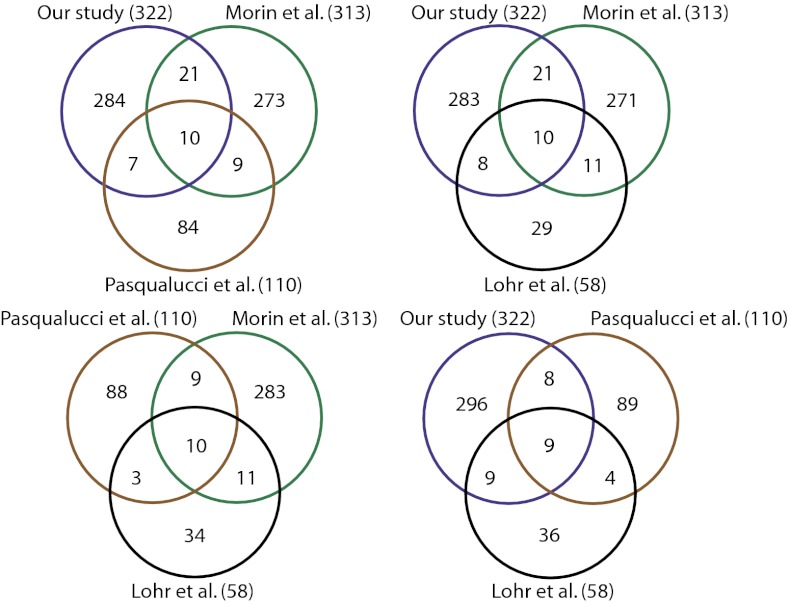
Diffuse large B-cell lymphoma (DLBCL) is the most common form of lymphoma in adults. The disease exhibits a striking heterogeneity in gene expression profiles and clinical outcomes, but its genetic causes remain to be fully defined. Through whole genome and exome sequencing, we characterized the genetic diversity of DLBCL. In all, we sequenced 73 DLBCL primary tumors (34 with matched normal DNA). Separately, we sequenced the exomes of 21 DLBCL cell lines. We identified 322 DLBCL cancer genes that were recurrently mutated in primary DLBCLs. We identified recurrent mutations implicating a number of known and not previously identified genes and pathways in DLBCL including those related to chromatin modification (ARID1A and MEF2B), NF-κB (CARD11 and TNFAIP3), PI3 kinase (PIK3CD, PIK3R1, and MTOR), B-cell lineage (IRF8, POU2F2, and GNA13), and WNT signaling (WIF1). We also experimentally validated a mutation in PIK3CD, a gene not previously implicated in lymphomas. The patterns of mutation demonstrated a classic long tail distribution with substantial variation of mutated genes from patient to patient and also between published studies. Thus, our study reveals the tremendous genetic heterogeneity that underlies lymphomas and highlights the need for personalized medicine approaches to treating these patients.


Conflict of interest statement

The authors declare no conflict of interest.

Figures

Fig. 1.
Fig. 1.
Results from sequencing a lymphoma genome. (A) Circos diagram (36) summarizing the somatically acquired genetic variants in a DLBCL genome. The outermost ring depicts the chromosome ideogram oriented clockwise, pter-qter. The next ring indicates copy number alterations in the DLCBL genome. The next three rings indicate somatically acquired mutations in intergenic regions, potential regulatory regions, and the exome respectively. (B) Pie chart depicts the relative number of somatically acquired mutations in the DLBCL genome, which can be classified by their genomic location as intergenic, intronic, potential regulatory, or transcribed regions (Left). (Right) Breakdown of different mutation types observed in the transcribed regions. (C) Histogram depicts the mutation profile of DLBCL. The proportion of mutations in each of the six mutational classes is shown. Transitions represent the majority of the somatically acquired mutations (P < 10−6).
Fig. 2.
Fig. 2.
Exome sequencing in DLBCLs. (A) Bar graph depicts the coverage achieved in each of the cases. The black line indicates our targeted level of 30-fold coverage. (B) Bar graph depicts the overlap between the variants identified by exome sequencing and multiplex PCR followed by deep sequencing (Raindance) in 179 genes in eight cases, as well as exome sequencing and SNP arrays in 43 cases. (C) Plot indicates the average number of additional sequence variants detected in the exomes as a function of adding each additional case. (D) Plot indicates the cumulative estimated number of rare exome variants discovered as a function of sample size. (E) Plot indicates the cumulative estimated number of somatically acquired exome variants discovered as a function of sample size (n = 1 through n = 34). (F) Pie chart indicates the relative distribution of missense, nonsense, frameshift, and synonymous base alterations in the entire dataset. (G) Pie chart indicates the relative distribution of missense, nonsense, frameshift, and synonymous base alterations in the 322 DLBCL cancer genes. (H) Histogram shows the relative distribution of different mutation classes in the 322 DLBCL cancer genes. The difference between the rates of transitions and transversions was highly statistically significant (P < 10−6). (I) Plot shows the relative sizes of all insertions/deletions in the entire dataset. (J) Plot shows the relative sizes of all insertions/deletions among the 322 DLBCL cancer gene variants.
Fig. 3.
Fig. 3.
Patterns of exonic mutations in DLBCLs. (A) Heat map indicates the pattern of mutations of the 322 DLBCL cancer genes in 73 primary DLBCLs and 21 DLBCL cell lines. Each column represents a patient or cell line and each row represents a DLBCL cancer gene. Mutation types are indicated in the legend. (B) Frequency of the 322 DLBCL cancer genes are indicated in the graph in descending order. (C) Bar graph shows the frequency of the 12 genes that were found to be differentially mutated in the activated B-cell–like DLBCL subgroup and the germinal center B-cell–like DLBCL subgroup. (D) Relative distribution of genetic mutations by gene ontology categories. The spans of the arcs indicate the relative numbers of different genes annotated with respect to gene ontology (37) terms. Representative genes in each group are shown next to each arc. Terms that match the described hallmarks of cancer (27) are marked with an asterisk.
Fig. 4.
Fig. 4.
PI3 kinase pathway in DLBCLs. (A) Deep sequencing reads identify a somatic mutation in PIK3CD in a DLBCL tumor. Sequencing reads matching the genome perfectly are shown in gray. The two samples differ only in a single nucleotide that is G in the tumor, but T (i.e., identical to reference genome) in the matched normal. The data were displayed using the Integrated Genomics Viewer (38). (B) Chromatograms display the results from Sanger sequencing in the same case. The sequenced bases demonstrate a T→G alteration in the tumor but not the matched normal. (C) Distribution of mutations occurring in the PI3 kinase pathway–related genes: PIK3R1, PIK3CD, and MTOR. Each blue diamond marks an individual mutation. Eleven separate events occurred in these three genes. (D) A molecular model of PIK3CD based on threading through the PIK3CG crystal structure. The location of the Asn-972 Lys (N972K) mutation identified in our sequencing data is highlighted within the C-lobe of the catalytic domain. (E) Western blot depicts the alteration in phosphorylated AKT expression initially and 3 h after the withdrawal of IL3. The relative expression of phospho-AKT (S473), with total AKT and β-actin loading controls, are shown. (F) The relative change in PI3 kinase activity is depicted as a function of altered phospho-AKT protein expression normalized to β-actin expression in three separate experiments. The P values were computed using a Student t test comparing the altered PI3 kinase activity in the cells before and after IL3 withdrawal. (+, IL3 exposure; −, IL3 withdrawal). (G) IC50s for 21 cell lines treated with a PI3 kinase inhibitor are shown. The three cell lines with mutated MTOR have approximately fivefold lower IC50s than the 18 cell lines with WT MTOR (P = 0.005).
Fig. 5.
Fig. 5.
Overlaps in genes discovered in multiple cancer studies. The Venn diagrams depict the comparison of gene mutations from the four DLBCL studies. The number in parentheses indicates the number of genes identified in each study. The gene lists were as follows: Morin et al. (Table S1 in Ref. , genes with confirmed somatic cases), Lohr et al. (Table 1 in Ref. , top 58 genes), and Pasqualucci et al. (Table S3 and Fig. 4 in Ref. , validated somatic genes).

References

    1. Morton LM, et al. Lymphoma incidence patterns by WHO subtype in the United States, 1992-2001. Blood. 2006;107(1):265–276. - PMC - PubMed
    1. Alizadeh AA, et al. Distinct types of diffuse large B-cell lymphoma identified by gene expression profiling. Nature. 2000;403(6769):503–511. - PubMed
    1. Monti S, et al. Molecular profiling of diffuse large B-cell lymphoma identifies robust subtypes including one characterized by host inflammatory response. Blood. 2005;105(5):1851–1861. - PubMed
    1. Ley TJ, et al. DNA sequencing of a cytogenetically normal acute myeloid leukaemia genome. Nature. 2008;456(7218):66–72. - PMC - PubMed
    1. Chapman MA, et al. Initial genome sequencing and analysis of multiple myeloma. Nature. 2011;471(7339):467–472. - PMC - PubMed

Publication types

MeSH terms

Substances

Associated data