

Application of natural blends of phytochemicals derived from the root exudates of Arabidopsis to the soil reveal that phenolic-related compounds predominantly modulate the soil microbiome
- PMID: 23293028
- PMCID: PMC3576057
- DOI: 10.1074/jbc.M112.433300
Application of natural blends of phytochemicals derived from the root exudates of Arabidopsis to the soil reveal that phenolic-related compounds predominantly modulate the soil microbiome
Erratum in
- J Biol Chem. 2013 Oct 18;288(42):30503
Abstract
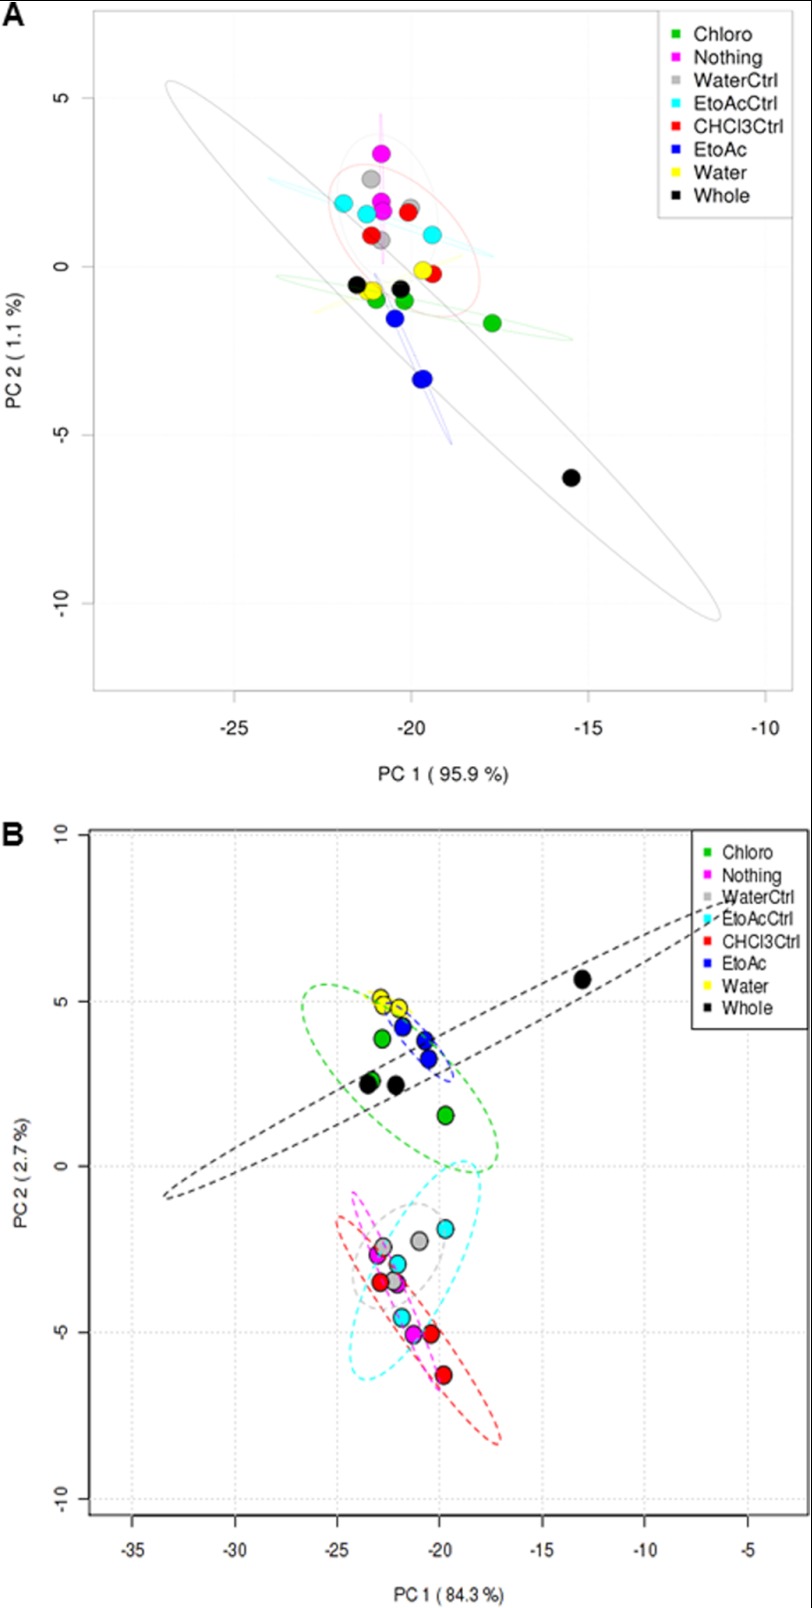
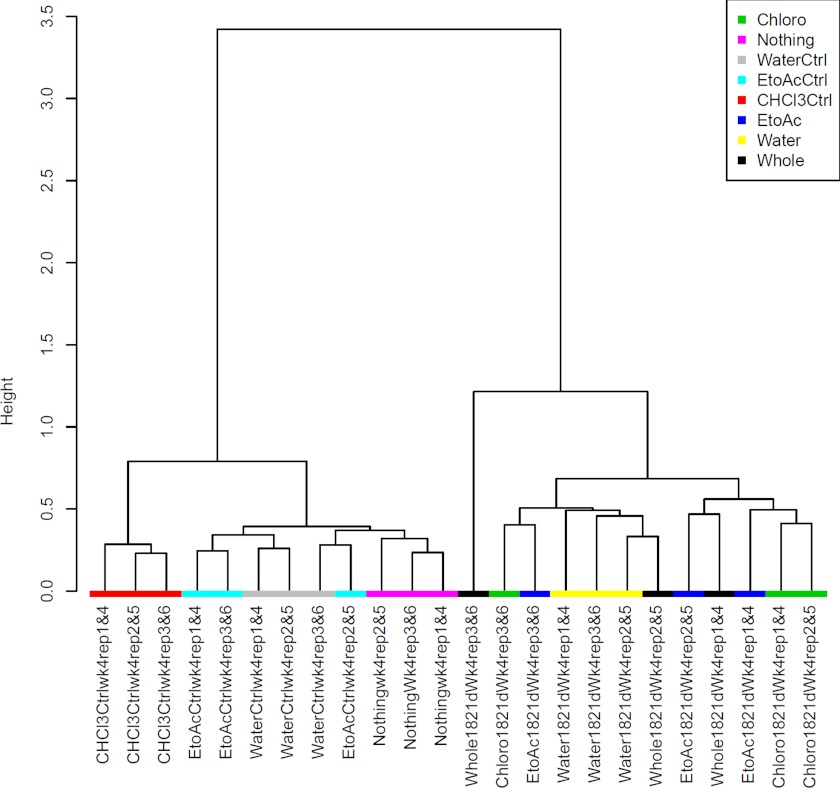
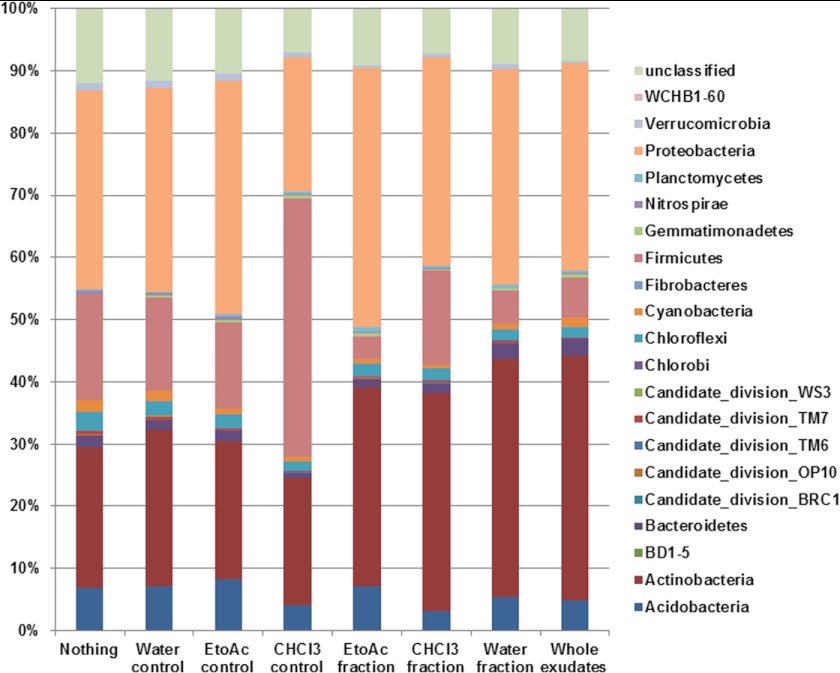
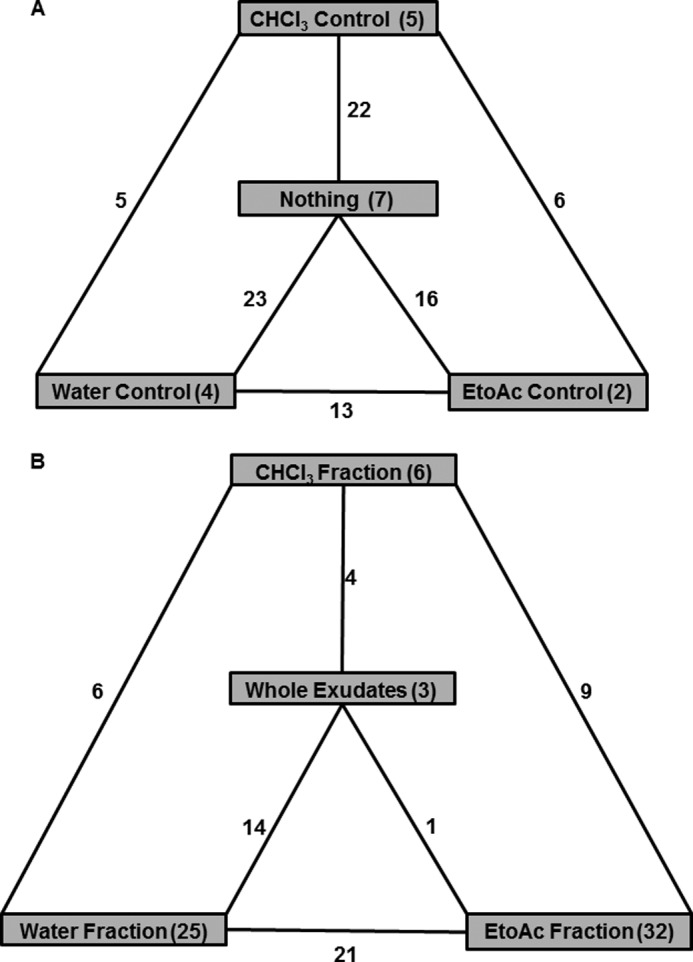
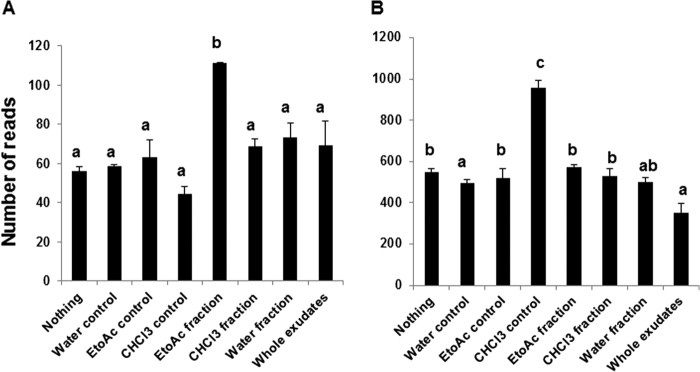
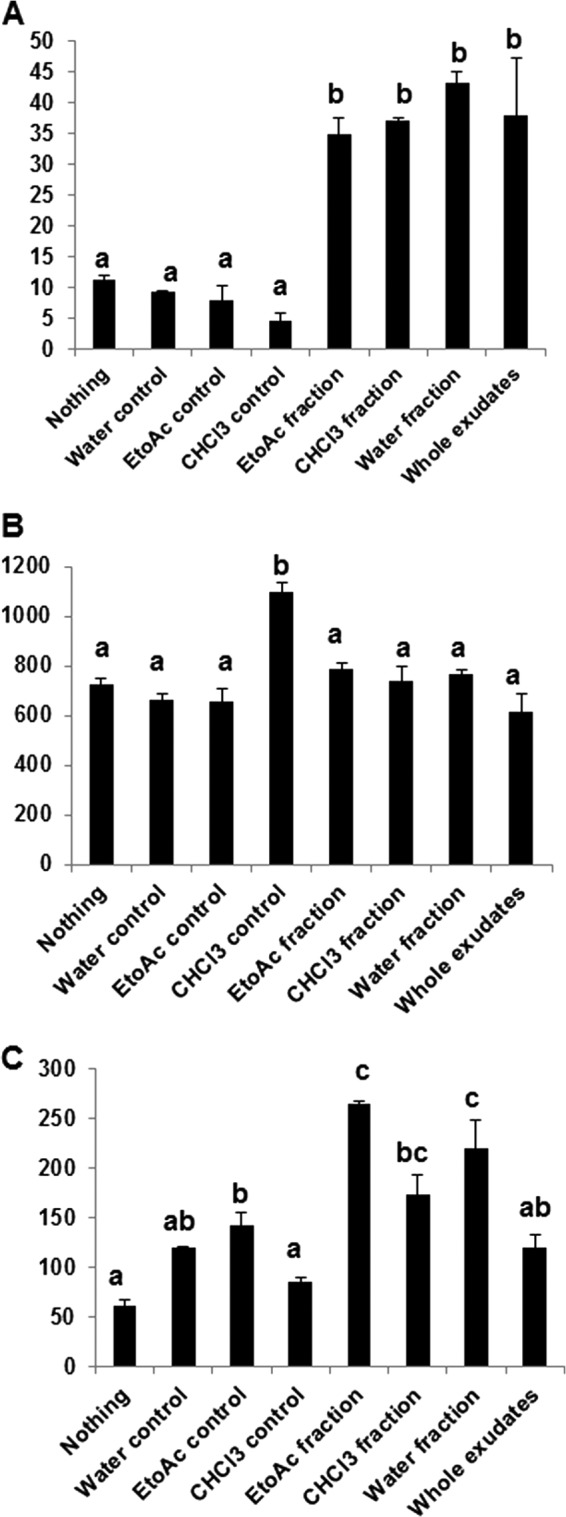
The roots of plants have the ability to influence its surrounding microbiology, the so-called rhizosphere microbiome, through the creation of specific chemical niches in the soil mediated by the release of phytochemicals. Here we report how these phytochemicals could modulate the microbial composition of a soil in the absence of the plant. For this purpose, root exudates of Arabidopsis were collected and fractionated to obtain natural blends of phytochemicals at various relative concentrations that were characterized by GC-MS and applied repeatedly to a soil. Soil bacterial changes were monitored by amplifying and pyrosequencing the 16 S ribosomal small subunit region. Our analyses reveal that one phytochemical can culture different operational taxonomic units (OTUs), mixtures of phytochemicals synergistically culture groups of OTUs, and the same phytochemical can act as a stimulator or deterrent to different groups of OTUs. Furthermore, phenolic-related compounds showed positive correlation with a higher number of unique OTUs compared with other groups of compounds (i.e. sugars, sugar alcohols, and amino acids). For instance, salicylic acid showed positive correlations with species of Corynebacterineae, Pseudonocardineae and Streptomycineae, and GABA correlated with species of Sphingomonas, Methylobacterium, Frankineae, Variovorax, Micromonosporineae, and Skermanella. These results imply that phenolic compounds act as specific substrates or signaling molecules for a large group of microbial species in the soil.
Figures
References
-
- Berendsen R. L., Pieterse C. M., Bakker P. A. (2012) The rhizosphere microbiome and plant health. Trends Plant Sci. 17, 478–486 - PubMed
-
- Hartmann A., Schmid M., van Tuinen D., Berg G. (2009) Plant-driven selection of microbes. Plant Soil 321, 235–257
-
- Badri D. V., Vivanco J. M. (2009) Regulation and function of root exudates. Plant Cell Environ. 32, 666–681 - PubMed
-
- Chaparro J., Sheflin A., Manter D., Vivanco J. (2012) Manipulating the soil microbiome to increase soil health and plant fertility. Biol. Fertil. Soil 48, 489–499
Publication types
MeSH terms
Substances
LinkOut - more resources
Full Text Sources
Other Literature Sources
Medical
Miscellaneous
