. 2013 Feb;17(2):219-35.
doi: 10.1016/j.media.2012.10.004. Epub 2012 Dec 13.

Multi-kernel graph embedding for detection, Gleason grading of prostate cancer via MRI/MRS

Affiliations

Multi-kernel graph embedding for detection, Gleason grading of prostate cancer via MRI/MRS

Pallavi Tiwari et al. Med Image Anal. 2013 Feb.

Abstract

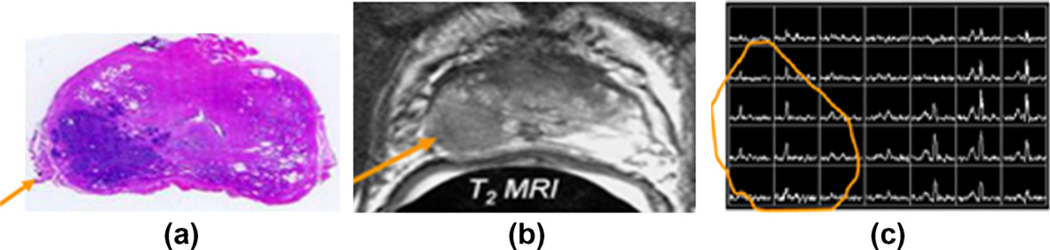
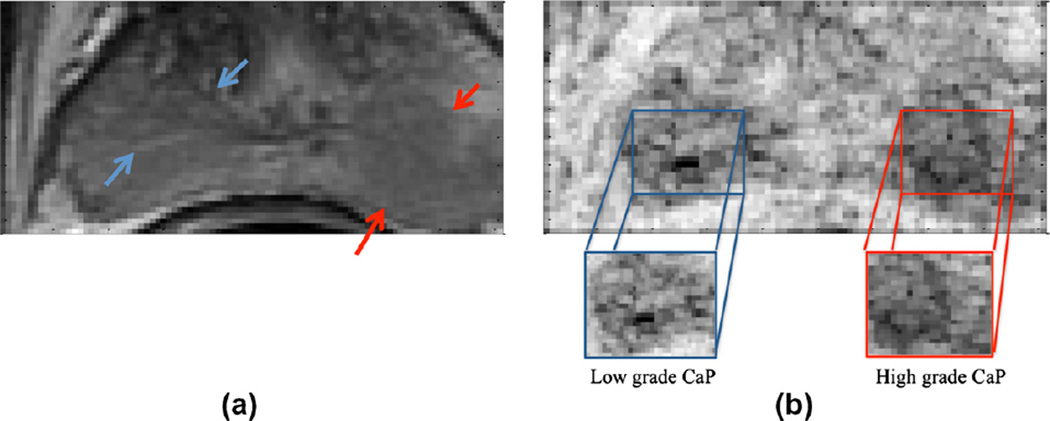
Even though 1 in 6 men in the US, in their lifetime are expected to be diagnosed with prostate cancer (CaP), only 1 in 37 is expected to die on account of it. Consequently, among many men diagnosed with CaP, there has been a recent trend to resort to active surveillance (wait and watch) if diagnosed with a lower Gleason score on biopsy, as opposed to seeking immediate treatment. Some researchers have recently identified imaging markers for low and high grade CaP on multi-parametric (MP) magnetic resonance (MR) imaging (such as T2 weighted MR imaging (T2w MRI) and MR spectroscopy (MRS)). In this paper, we present a novel computerized decision support system (DSS), called Semi Supervised Multi Kernel Graph Embedding (SeSMiK-GE), that quantitatively combines structural, and metabolic imaging data for distinguishing (a) benign versus cancerous, and (b) high- versus low-Gleason grade CaP regions from in vivo MP-MRI. A total of 29 1.5Tesla endorectal pre-operative in vivo MP MRI (T2w MRI, MRS) studies from patients undergoing radical prostatectomy were considered in this study. Ground truth for evaluation of the SeSMiK-GE classifier was obtained via annotation of disease extent on the pre-operative imaging by visually correlating the MRI to the ex vivo whole mount histologic specimens. The SeSMiK-GE framework comprises of three main modules: (1) multi-kernel learning, (2) semi-supervised learning, and (3) dimensionality reduction, which are leveraged for the construction of an integrated low dimensional representation of the different imaging and non-imaging MRI protocols. Hierarchical classifiers for diagnosis and Gleason grading of CaP are then constructed within this unified low dimensional representation. Step 1 of the hierarchical classifier employs a random forest classifier in conjunction with the SeSMiK-GE based data representation and a probabilistic pairwise Markov Random Field algorithm (which allows for imposition of local spatial constraints) to yield a voxel based classification of CaP presence. The CaP region of interest identified in Step 1 is then subsequently classified as either high or low Gleason grade CaP in Step 2. Comparing SeSMiK-GE with unimodal T2w MRI, MRS classifiers and a commonly used feature concatenation (COD) strategy, yielded areas (AUC) under the receiver operative curve (ROC) of (a) 0.89±0.09 (SeSMiK), 0.54±0.18 (T2w MRI), 0.61±0.20 (MRS), and 0.64±0.23 (COD) for distinguishing benign from CaP regions, and (b) 0.84±0.07 (SeSMiK),0.54±0.13 (MRI), 0.59±0.19 (MRS), and 0.62±0.18 (COD) for distinguishing high and low grade CaP using a leave one out cross-validation strategy, all evaluations being performed on a per voxel basis. Our results suggest that following further rigorous validation, SeSMiK-GE could be developed into a powerful diagnostic and prognostic tool for detection and grading of CaP in vivo and in helping to determine the appropriate treatment option. Identifying low grade disease in vivo might allow CaP patients to opt for active surveillance rather than immediately opt for aggressive therapy such as radical prostatectomy.


Figures

Fig. 1
Fig. 1
Flowchart showing various components of SeSMiK-GE. MKL and SSDR are performed simultaneously on the M individual data channels followed by DR on the combined kernel and weight matrix. A supervised classifier is subsequently trained in the integrated low dimensional space to discriminate the object classes (shown via different colors in the right most panel). (For interpretation of the references to colour in this figure legend, the reader is referred to the web version of this article.)
Fig. 2
Fig. 2
Flowchart showing the hierarchical classification strategy employed in this work for CaP detection and grading. In Step 1, CaP ROI is identified using RF and PPMM classifier trained on the SeSMiK-GE derived low dimensional data representation. In Step 2, CaP regions identified in Step 1, are further discriminated as high and low grade CaP.
Fig. 3
Fig. 3
(a) Ground truth for CaP extent as defined through the histopathological analysis of hemotoxylin and eosin stained tissue section. The histological CaP extent in (a) is then visually registered onto the corresponding T2w MRI (b) and MRS sections (c) by an expert using histology as a visual reference.
Fig. 4
Fig. 4
Illustration of the standardized five point scale spectra classified as (a) likely benign (scale 1), (b) probably benign (scale 2), (c) equivocal (scale 3), (d) probably malignant (scale 4) and (e) likely malignant (scale 5) (Fig. 3 reproduced from Jung et al. (2004) with permission of the author).
Fig. 5
Fig. 5
(a) Ground truth for high (red arrows) and low grade (blue arrows) CaP extent on a single T2w MRI section. (b) A grey-level texture feature for the corresponding section used to illustrate subtle, yet existing texture differences for low and high grade CaP regions on the same section. (For interpretation of the references to colour in this figure legend, the reader is referred to the web version of this article.)
Fig. 6
Fig. 6
Box-and-whisker plot results of AUC (a) and accuracy (b) obtained over 29 studies via a LOO CV strategy for T2, MRS, Int, IntD, and T2MRS. (c and d) The box-whisker-plots for threefold CV strategy over 25 CV runs for AUC and accuracy respectively. Note that the red line in the middle of each box reflects the median value while the box is bounded by 25 and 75 percentile of AUC (a and c) and accuracy (b and d) values. The whisker plot extends to the minimum and maximum values outside the box and the outliers are denoted as the red plus symbol for different feature extraction strategies. (For interpretation of the references to colour in this figure legend, the reader is referred to the web version of this article.)
Fig. 7
Fig. 7
(a), (d) and (g) show three different T2w MRI sections with CaP ground truth (as annotated by an expert) outlined in yellow, while the high grade CaP ground truth outlined in red. (b), (e), and (h) show the probability heat map results corresponding to CaP classification on T2w MRI sections (by interpolating the CaP probabilities at MRS resolution to a pixel level T2w MRI resolution using Gaussian smoothing) in (a), (d), and (g) respectively for three different T2w MRI studies. (c), (f), and (i) show the probability heat maps corresponding to high grade CaP classification performed within the spatial locations identified as high probabilistic CaP regions (shown in red, obtained by interpolating the high grade CaP probabilities at MRS resolution to a pixel level T2w MRI resolution using Gaussian smoothing) in (b), (e) and (h) respectively. Note that locations shown in red in (b), (e), and (h) correspond to those identified by hT2MRS as CaP while in (c), (f), and (i) as those identified as high grade CaP by ĥT2MRS. Similarly the spatial locations shown in blue in (b), (e), and (h) correspond to spatial locations classified as benign and as low grade CaP in (c), (f), and (i). (For interpretation of the references to colour in this figure legend, the reader is referred to the web version of this article.)
Fig. 8
Fig. 8
Box-and-whisker plot results of AUC (a) and accuracy (b) obtained over 12 studies via a LOO CV strategy for ĥT2, ĥMRS, ĥInt, ĥIntD, and ĥT2MRS. Corresponding results obtained via a threefold-CV are shown in (c and d). Note that the red line in the middle of each box reflects the median value while the box is bounded by 25 and 75 percentile of AUC (a and c) and accuracy (b and d) values. The whisker plot extends to the minimum and maximum values outside the box and the outliers are denoted as the red plus symbol for different feature extraction strategies. (For interpretation of the references to colour in this figure legend, the reader is referred to the web version of this article.)
Fig. 9
Fig. 9
Average ROC curves for (a) CaP versus benign classification using hT2, hMRS, hInt, hT2MRS, T2MRS and (b) high vs. low grade CaP using ĥT2, ĥMRS, ĥInt, and ĥT2MRS for d = 15.
Fig. 10
Fig. 10
(a) High grade CaP ground truth (outlined in red) as annotated by an expert, where label 2 = Gleason score 7 (3 + 4), and label 5 = Gleason score 9 (>4 + 4) spectra on a single T2w MRI section. (b) The corresponding classification result obtained by thresholding the probability values at the operating point v on MRS grid, where red corresponds to high probability of high grade CaP and blue corresponds to high probability of low grade CaP. Note the high detection sensitivity and specificity obtained via SeSMiK-GE in accurately localizing high grade CaP region. Also note the elevated choline peak in all the metavoxels identified as high grade (in red). Elevation in choline has clinically been shown to be correlated with high grade CaP. (For interpretation of the references to colour in this figure legend, the reader is referred to the web version of this article.)

References

    1. Ampeliotis D, Antonakoudi A, Berberidis K, Psarakis EZ, Kounoudes A. A computer-aided system for the detection of prostate cancer based on magnetic resonance image analysis. Communications, Control and Signal Processing. 2008:1372–1377.
    1. Bostwick DG. Grading prostate cancer. American Journal of Clinical Pathology. 1994;102:S38–S56. - PubMed
    1. Breiman L. Random forest. Machine Learning. 2001;451:5–32.
    1. Cai D, He X, Hu Y, Han J, Huang T. Learning a spatially smooth subspace for face recognition. Proc. IEEE Conf. Computer Vision and Pattern Recognition Machine Learning (CVPR’07) 2007:1–7.
    1. Carroll P, Coakley F, Kurhanewicz J. Magnetic resonance imaging and spectroscopy of prostate cancer. Reviews in Urology. 2006;8(1):S4–S10. - PMC - PubMed

Publication types

MeSH terms

Substances