

Integrative molecular analysis of intrahepatic cholangiocarcinoma reveals 2 classes that have different outcomes
- PMID: 23295441
- PMCID: PMC3624083
- DOI: 10.1053/j.gastro.2013.01.001
Integrative molecular analysis of intrahepatic cholangiocarcinoma reveals 2 classes that have different outcomes
Abstract
Background & aims: Cholangiocarcinoma, the second most common liver cancer, can be classified as intrahepatic cholangiocarcinoma (ICC) or extrahepatic cholangiocarcinoma. We performed an integrative genomic analysis of ICC samples from a large series of patients.
Methods: We performed a gene expression profile, high-density single-nucleotide polymorphism array, and mutation analyses using formalin-fixed ICC samples from 149 patients. Associations with clinicopathologic traits and patient outcomes were examined for 119 cases. Class discovery was based on a non-negative matrix factorization algorithm and significant copy number variations were identified by Genomic Identification of Significant Targets in Cancer (GISTIC) analysis. Gene set enrichment analysis was used to identify signaling pathways activated in specific molecular classes of tumors, and to analyze their genomic overlap with hepatocellular carcinoma (HCC).
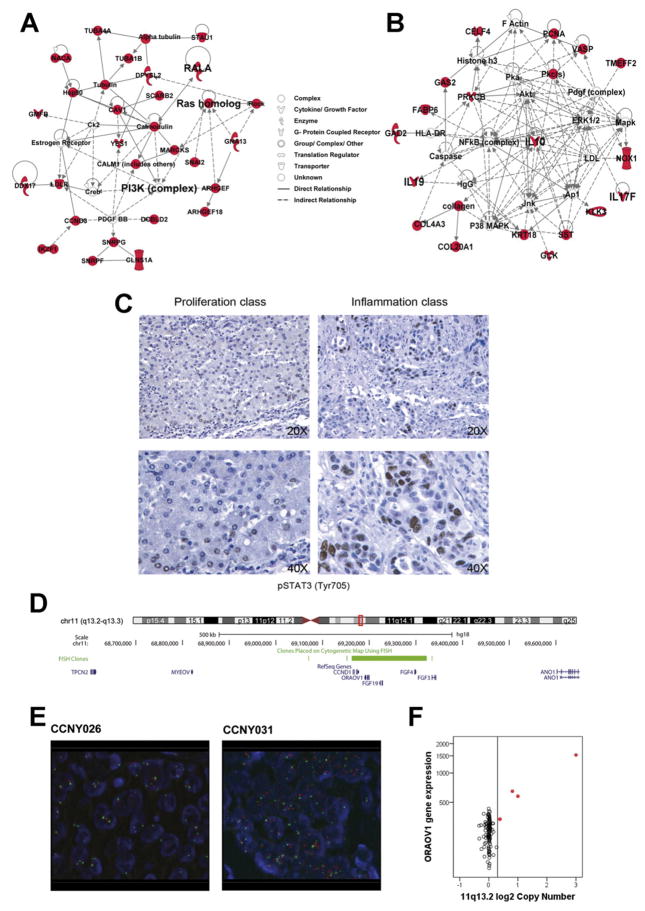
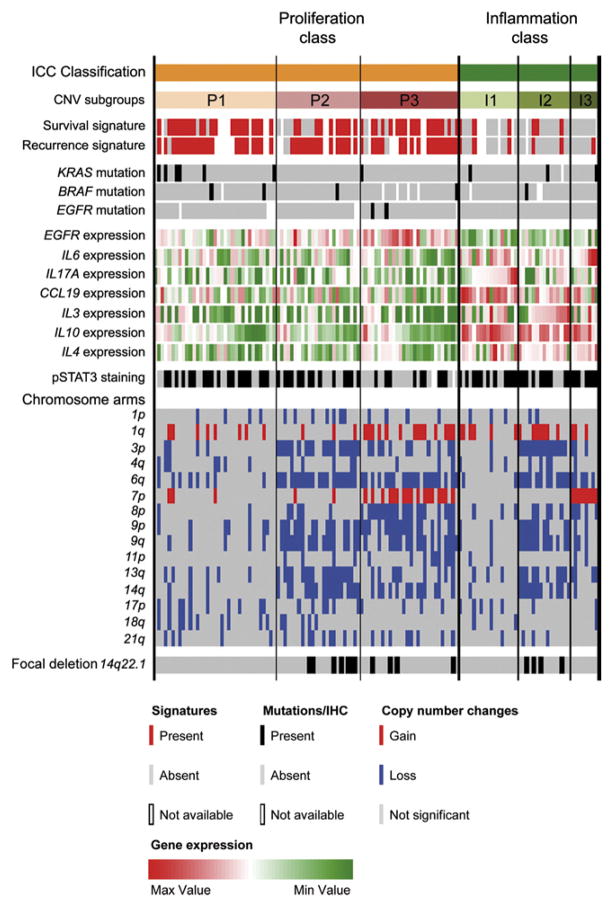
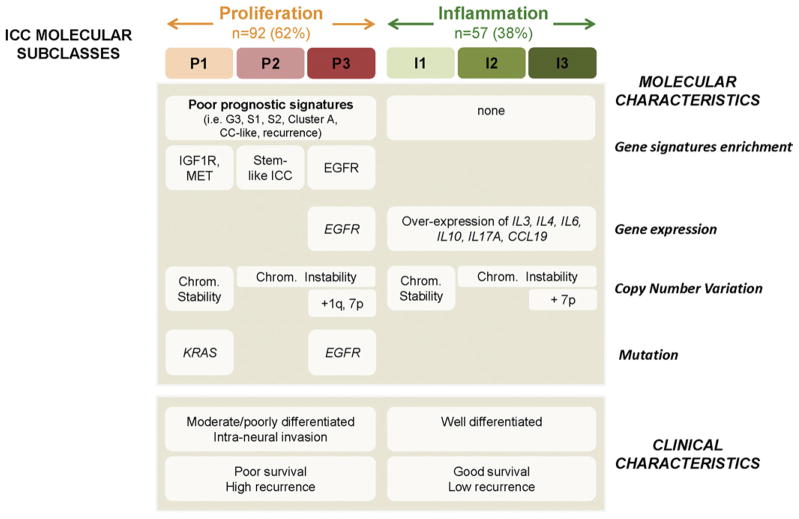
Results: We identified 2 main biological classes of ICC. The inflammation class (38% of ICCs) is characterized by activation of inflammatory signaling pathways, overexpression of cytokines, and STAT3 activation. The proliferation class (62%) is characterized by activation of oncogenic signaling pathways (including RAS, mitogen-activated protein kinase, and MET), DNA amplifications at 11q13.2, deletions at 14q22.1, mutations in KRAS and BRAF, and gene expression signatures previously associated with poor outcomes for patients with HCC. Copy number variation-based clustering was able to refine these molecular groups further. We identified high-level amplifications in 5 regions, including 1p13 (9%) and 11q13.2 (4%), and several focal deletions, such as 9p21.3 (18%) and 14q22.1 (12% in coding regions for the SAV1 tumor suppressor). In a complementary approach, we identified a gene expression signature that was associated with reduced survival times of patients with ICC; this signature was enriched in the proliferation class (P < .001).
Conclusions: We used an integrative genomic analysis to identify 2 classes of ICC. The proliferation class has specific copy number alterations, activation of oncogenic pathways, and is associated with worse outcome. Different classes of ICC, based on molecular features, therefore might require different treatment approaches.
Copyright © 2013 AGA Institute. Published by Elsevier Inc. All rights reserved.
Conflict of interest statement
Conflicts of interest
The authors disclose no conflicts.
Figures

Comment in
-
Genomic decoding of intrahepatic cholangiocarcinoma reveals therapeutic opportunities.Gastroenterology. 2013 Apr;144(4):687-90. doi: 10.1053/j.gastro.2013.02.018. Epub 2013 Feb 24. Gastroenterology. 2013. PMID: 23462122 No abstract available.
References
-
- Bleachacz BR, Gores GJ. Cholangiocarcinoma. Clin Liver Dis. 2008;12:131–150. - PubMed
-
- Sempoux C, Jibara G, Ward S, et al. Intrahepatic cholangiocarcinoma: new insights in pathology. Semin Liver Dis. 2011;31:104–110. - PubMed
-
- Khan SA, Taylor-Robinson SD, Toledano MB, et al. Changing international trends in mortality rates for liver, biliary and pancreatic tumours. J Hepatol. 2002;37:806–813. - PubMed
-
- Singh P, Patel T. Advances in the diagnosis, evaluation and management of cholangiocarcinoma. Curr Opin Gastroenterol. 2006;22:294–299. - PubMed
-
- Valle J, Wasan H, Palmer DH, et al. Cisplatin plus gemcitabine versus gemcitabine for biliary tract cancer. N Engl J Med. 2010;362:1273–1281. - PubMed
Publication types
MeSH terms
Associated data
- Actions
Grants and funding
LinkOut - more resources
Full Text Sources
Other Literature Sources
Medical
Molecular Biology Databases
Research Materials
Miscellaneous
