

The relationship between the C-statistic of a risk-adjustment model and the accuracy of hospital report cards: a Monte Carlo Study
- PMID: 23295579
- PMCID: PMC4617826
- DOI: 10.1097/MLR.0b013e31827ff0dc
The relationship between the C-statistic of a risk-adjustment model and the accuracy of hospital report cards: a Monte Carlo Study
Abstract
Background: Hospital report cards, in which outcomes following the provision of medical or surgical care are compared across health care providers, are being published with increasing frequency. Essential to the production of these reports is risk-adjustment, which allows investigators to account for differences in the distribution of patient illness severity across different hospitals. Logistic regression models are frequently used for risk adjustment in hospital report cards. Many applied researchers use the c-statistic (equivalent to the area under the receiver operating characteristic curve) of the logistic regression model as a measure of the credibility and accuracy of hospital report cards.
Objectives: To determine the relationship between the c-statistic of a risk-adjustment model and the accuracy of hospital report cards.
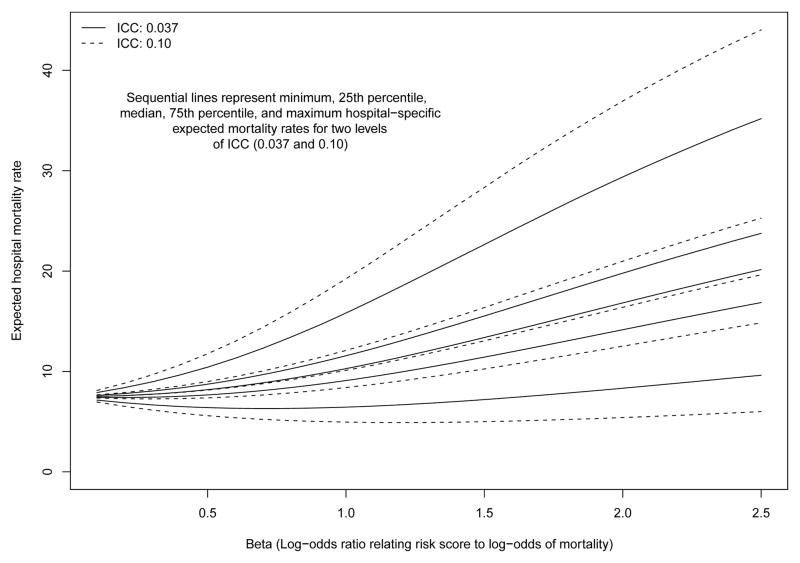
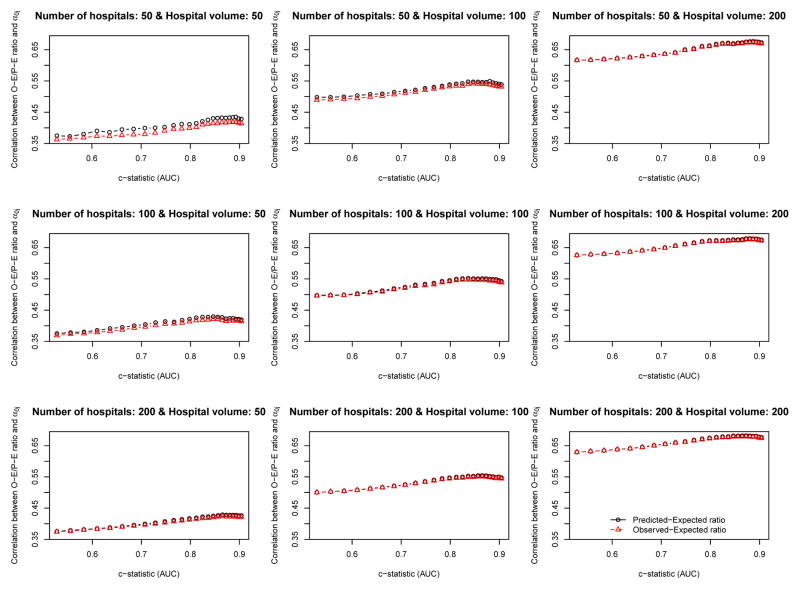
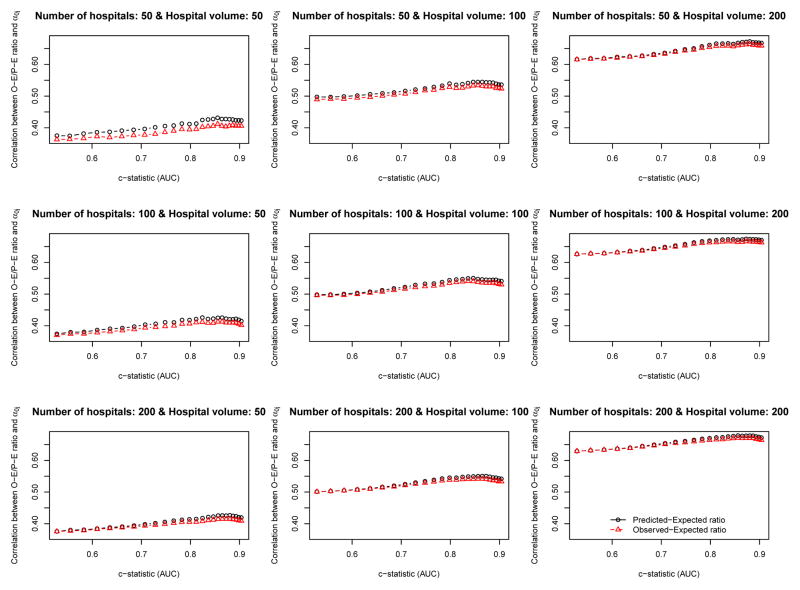
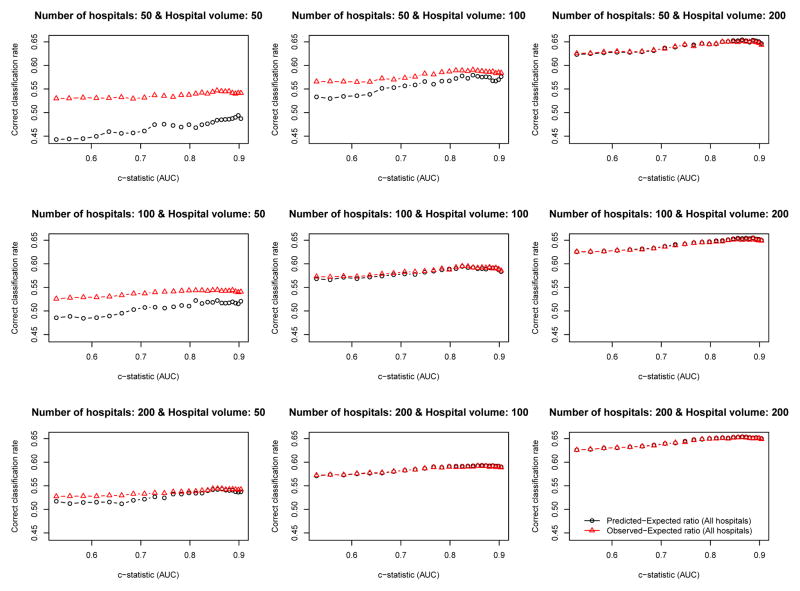
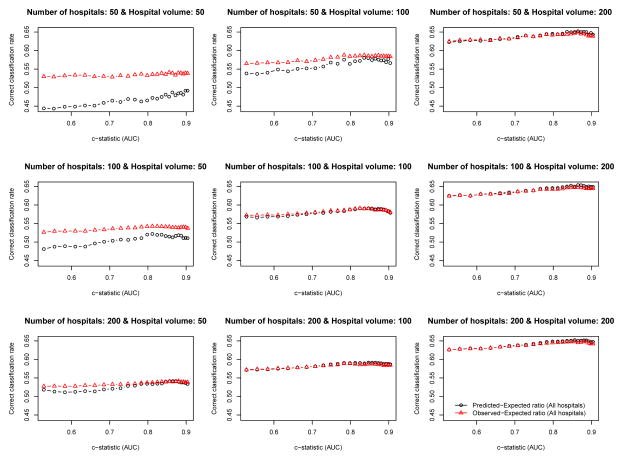
Research design: Monte Carlo simulations were used to examine this issue. We examined the influence of 3 factors on the accuracy of hospital report cards: the c-statistic of the logistic regression model used for risk adjustment, the number of hospitals, and the number of patients treated at each hospital. The parameters used to generate the simulated datasets came from analyses of patients hospitalized with a diagnosis of acute myocardial infarction in Ontario, Canada.
Results: The c-statistic of the risk-adjustment model had, at most, a very modest impact on the accuracy of hospital report cards, whereas the number of patients treated at each hospital had a much greater impact.
Conclusions: The c-statistic of a risk-adjustment model should not be used to assess the accuracy of a hospital report card.
Figures
Comment in
-
Comment on "the relationship between the C-statistic of a risk-adjustment model and the accuracy of hospital report cards: a Monte Carlo study".Med Care. 2013 Jul;51(7):633. doi: 10.1097/MLR.0b013e318297608b. Med Care. 2013. PMID: 23685404 No abstract available.
-
In response.Med Care. 2013 Jul;51(7):633-5. doi: 10.1097/MLR.0b013e31829760b6. Med Care. 2013. PMID: 23685405 No abstract available.
References
-
- Luft HS, Romano PS, Remy LL, Rainwater J. Annual Report of the California Hospital Outcomes Project. Sacramento, CA: California Office of Statewide Health Planning and Development; 1993.
-
- Pennsylvania Health Care Cost Containment Council. Focus on heart attack in Pennsylvania: research methods and results. Harrisburg, PA: Pennsylvania Health Care Cost Containment Council; 1996.
-
- Scottish Office. Clinical outcome indicators, 1994. Vol. 1995 Scottish Office; 1995.
-
- Naylor CD, Rothwell DM, Tu JV, Austin PC . the Cardiac Care Network Steering Committee. Outcomes of Coronary Artery Bypass Surgery in Ontario. In: Naylor CD, Slaughter PM, editors. Cardiovascular Health and Services in Ontario: An ICES Atlas. Institute for Clinical Evaluative Sciences; Toronto: 1999. pp. 189–198.
-
- Massachusetts Data Analysis Center. Adult Coronary Artery Bypass Graft Surgery in the Commonwealth of Massachusetts: Fiscal Year 2010 Report. Boston, MA: Department of Health Care Policy, Harvard Medical School; 2012.
Publication types
MeSH terms
Grants and funding
LinkOut - more resources
Full Text Sources
Other Literature Sources
Medical
