. 2013 Feb 1;41(4):2296-312.
doi: 10.1093/nar/gks1325. Epub 2013 Jan 7.

Cell cycle stage-specific roles of Rad18 in tolerance and repair of oxidative DNA damage

Affiliations

Cell cycle stage-specific roles of Rad18 in tolerance and repair of oxidative DNA damage

Yang Yang et al. Nucleic Acids Res. .

Abstract

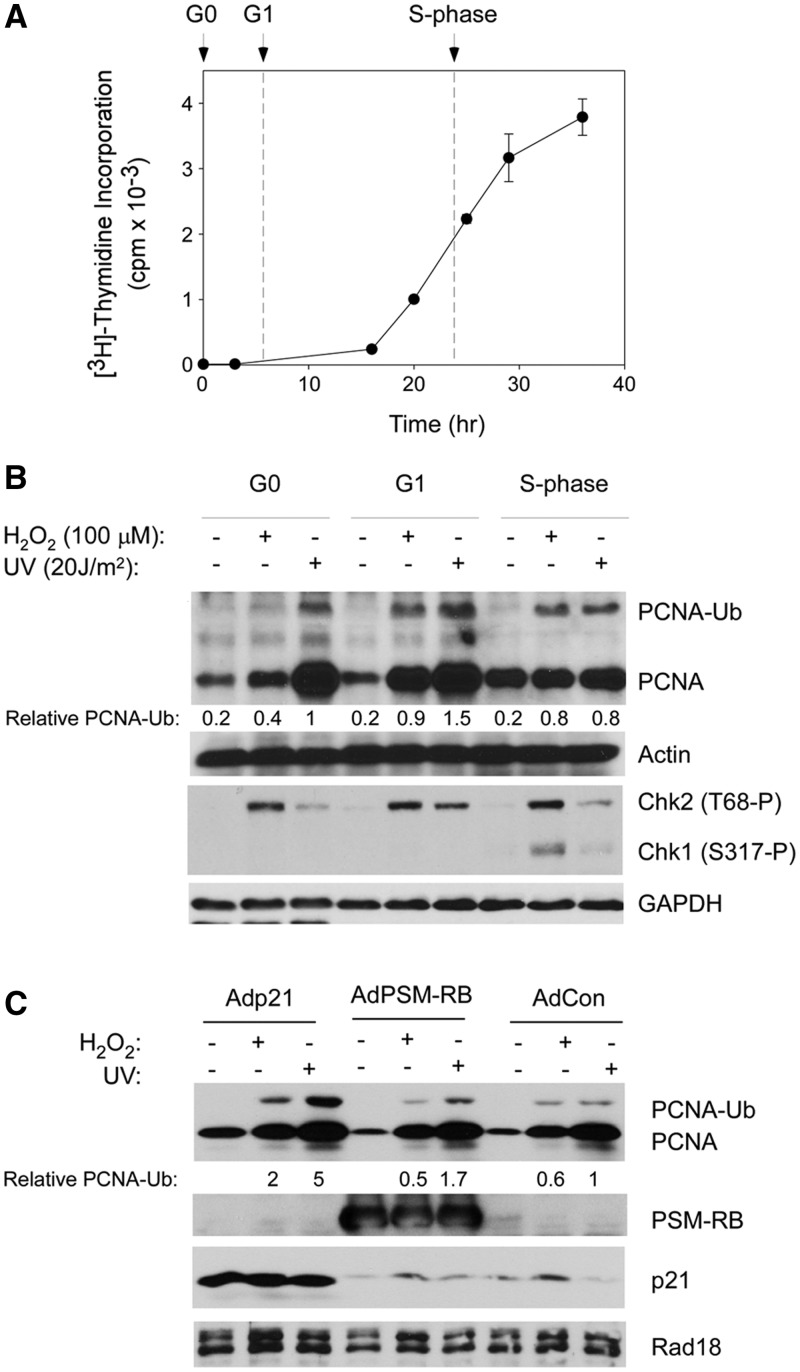
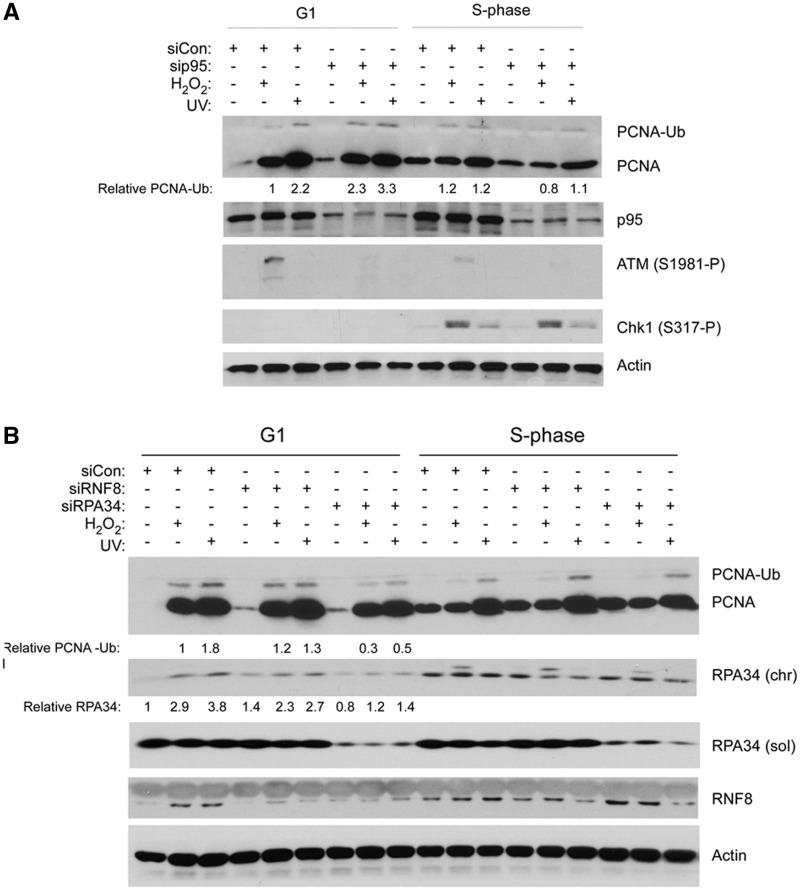
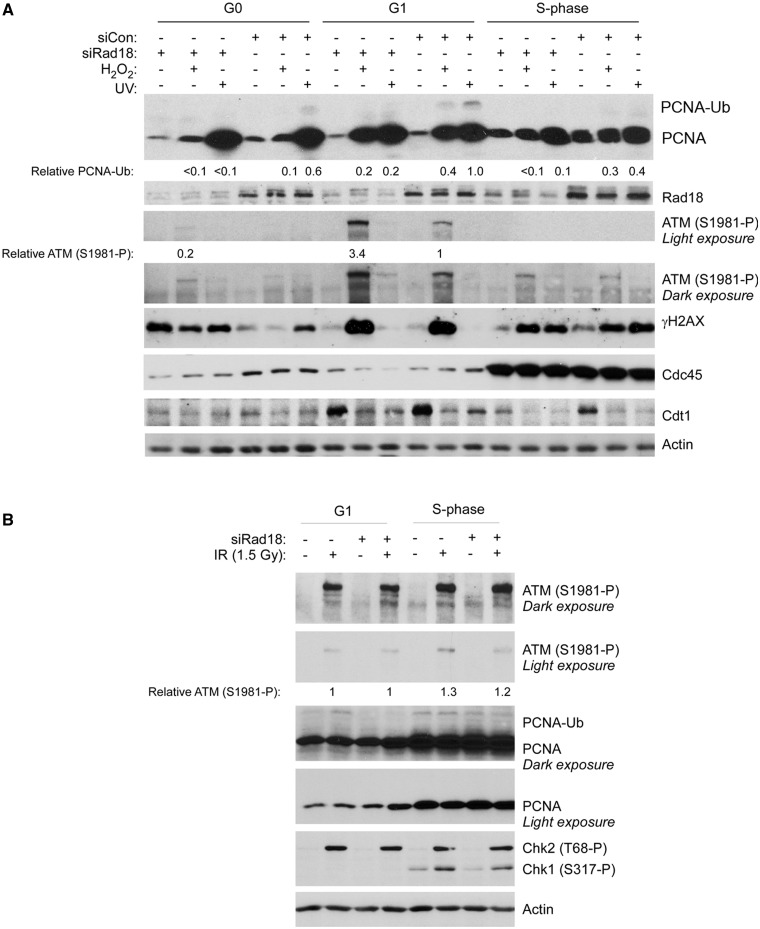
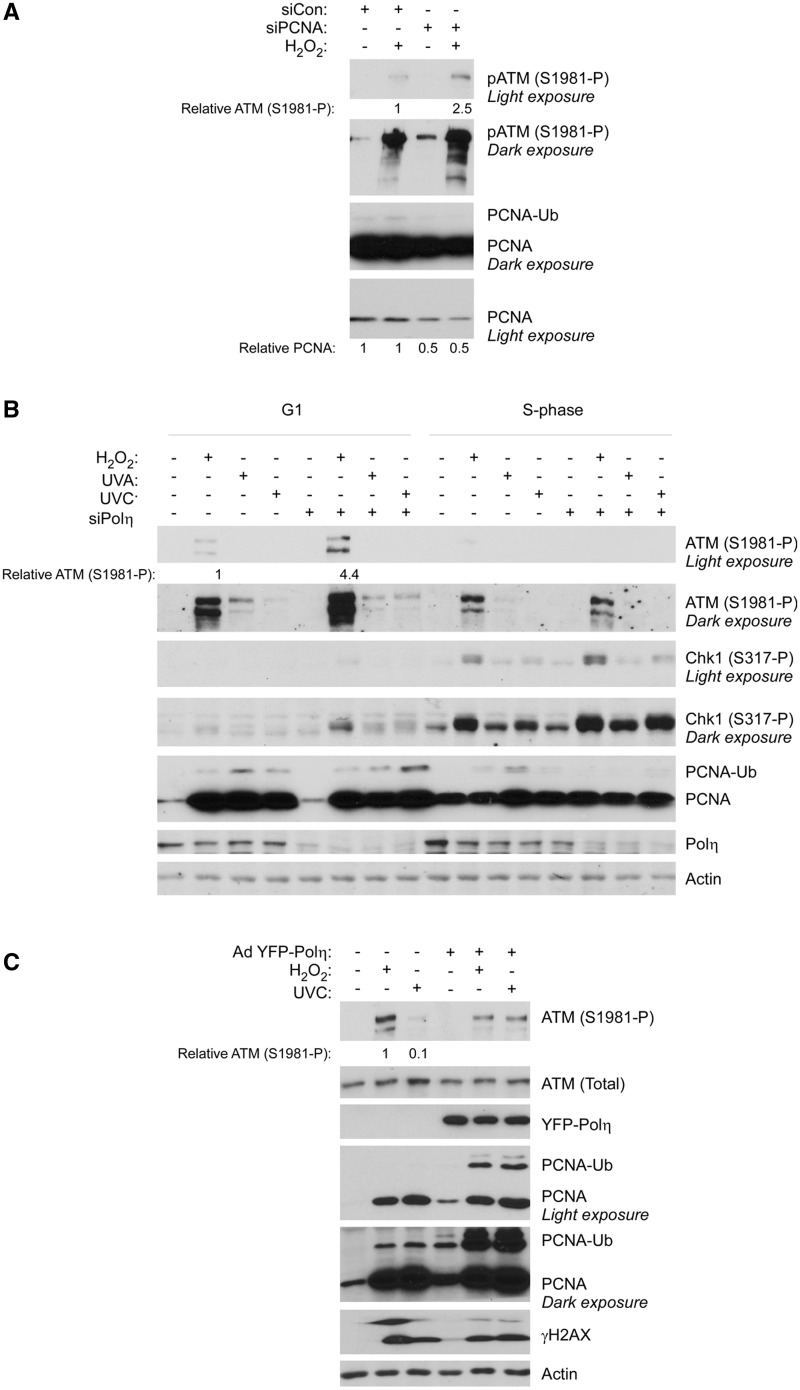
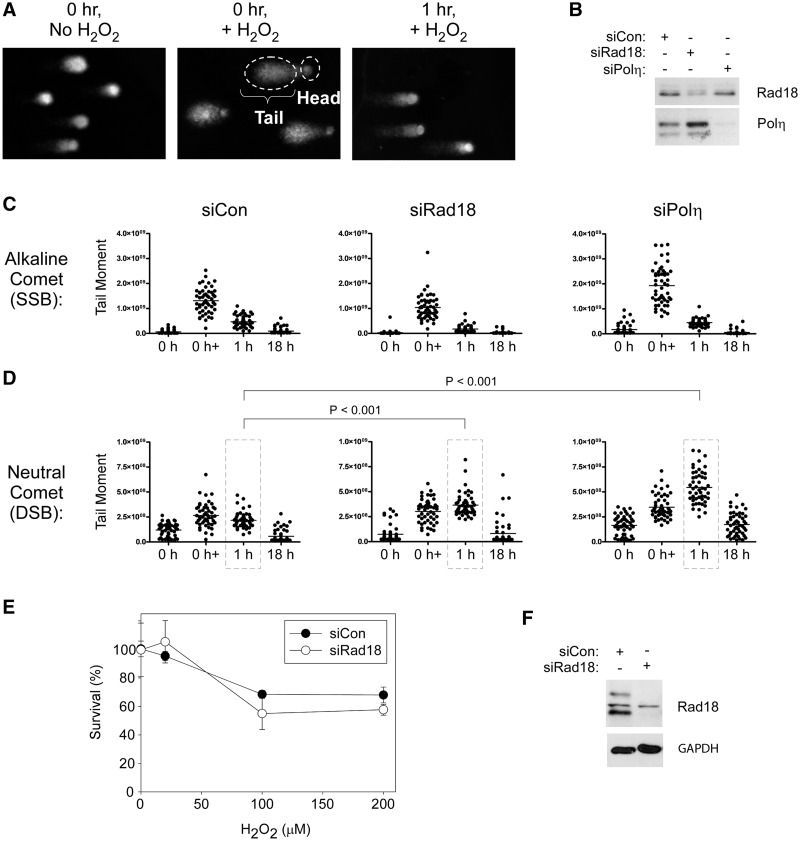
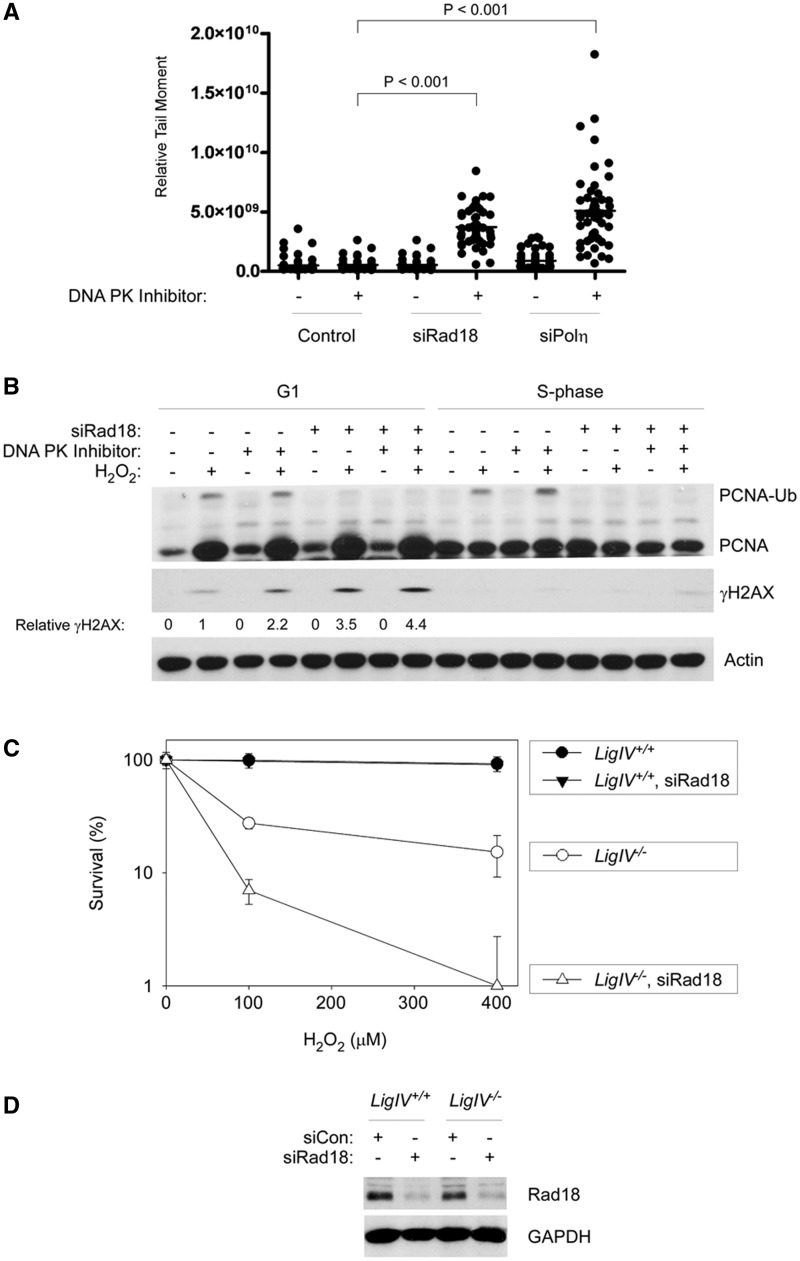
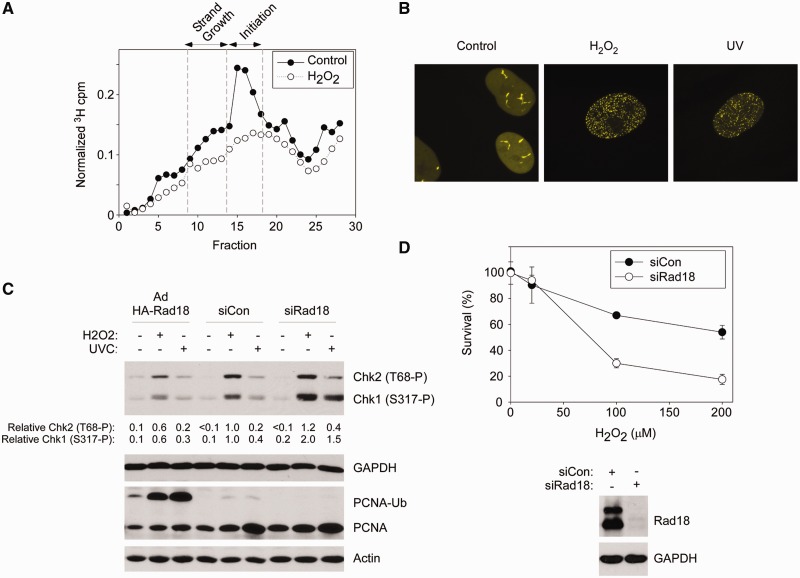
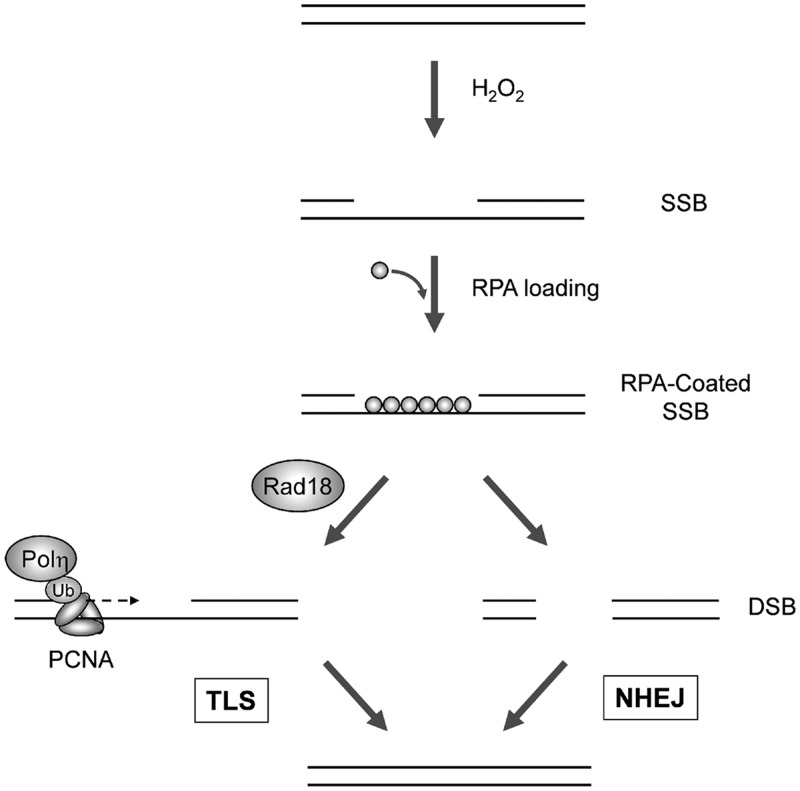
The E3 ubiquitin ligase Rad18 mediates tolerance of replication fork-stalling bulky DNA lesions, but whether Rad18 mediates tolerance of bulky DNA lesions acquired outside S-phase is unclear. Using synchronized cultures of primary human cells, we defined cell cycle stage-specific contributions of Rad18 to genome maintenance in response to ultraviolet C (UVC) and H(2)O(2)-induced DNA damage. UVC and H(2)O(2) treatments both induced Rad18-mediated proliferating cell nuclear antigen mono-ubiquitination during G(0), G(1) and S-phase. Rad18 was important for repressing H(2)O(2)-induced (but not ultraviolet-induced) double strand break (DSB) accumulation and ATM S1981 phosphorylation only during G(1), indicating a specific role for Rad18 in processing of oxidative DNA lesions outside S-phase. However, H(2)O(2)-induced DSB formation in Rad18-depleted G1 cells was not associated with increased genotoxin sensitivity, indicating that back-up DSB repair mechanisms compensate for Rad18 deficiency. Indeed, in DNA LigIV-deficient cells Rad18-depletion conferred H(2)O(2)-sensitivity, demonstrating functional redundancy between Rad18 and non-homologous end joining for tolerance of oxidative DNA damage acquired during G(1). In contrast with G(1)-synchronized cultures, S-phase cells were H(2)O(2)-sensitive following Rad18-depletion. We conclude that although Rad18 pathway activation by oxidative lesions is not restricted to S-phase, Rad18-mediated trans-lesion synthesis by Polη is dispensable for damage-tolerance in G(1) (because of back-up non-homologous end joining-mediated DSB repair), yet Rad18 is necessary for damage tolerance during S-phase.


Figures

Figure 1.
Figure 1.
PCNA mono-ubiquitination in different cell cycle phases of synchronized HDF. (A) HDF were synchronized as described under ‘Materials and Methods’ section. At the indicated times after release from quiescence, rates of DNA synthesis were determined using [3H]-thymidine incorporation assays. Each time-point represents a mean of triplicate determinations, and the error bars represent the deviations from the mean. The time points used in all subsequent experiments for cell cycle stage-specific genotoxin treatments in G0, G1 and S-phase cells are indicated by the arrows. (B) G0-, G1- or S-phase-synchronized HDF were treated with 100 µM of H2O2 or 20 J/m2 of UVC (or were left untreated for control samples) as described under ‘Materials and Methods’ sections. Chromatin (PCNA, actin) and soluble (Chk1, Chk2, GAPDH) fractions were isolated and analysed by SDS–PAGE and immunoblotting with antibodies against the indicated proteins. Bands corresponding to mono-ubiquitinated PCNA were quantified by densitometry. The amount of mono-ubiquitinated PCNA in each lane is expressed relative to the amount of mono-ubiquitinated PCNA in UV-treated G0 fibroblasts. In this and subsequent figures, ‘relative PCNA-Ub’ compares total amount of chromatin-associated mono-ubiquitinated PCNA in the cells under different experimental conditions. No attempt was made to normalize the amount of mono-ubiquitinated PCNA-Ub to the level of chromatin-associated unmodified PCNA. (C) Quiescent HDF were infected with adenovirus vectors encoding p21, PSM7-RB or with an ‘empty’ control vector (AdCon). Adenovirus-infected cells were stimulated to enter G1 and subject to genotoxin treatments as indicated. Chromatin extracts were isolated 1 h after genotoxin treatments and analysed by SDS–PAGE and immunoblotting with antibodies against the indicated proteins.
Figure 2.
Figure 2.
PCNA mono-ubiquitination during G1 is RPA-dependent and p95-independent. (A) Replicate cultures of HDF were transfected with siRNA targeting p95 or with a scrambled control siRNA. The control and p95-depleted cells were synchronized in G1 and S-phase and treated with genotoxins. Chromatin extracts were isolated 1 h after genotoxin treatments and analysed by SDS–PAGE and immunoblotting with the indicated antibodies. (B) Replicate cultures of HDF were transfected with siRNA targeting RPA34, RNF8 or with a scrambled control siRNA. The resulting cells were synchronized in G1 and S-phase and treated with genotoxins. Chromatin extracts were isolated and analysed by SDS–PAGE and immunoblotting with the indicated antibodies. Bands corresponding to chromatin-bound RPA34 were quantified by densitometry. The amount of RPA34 in each lane is expressed relative to the amount of RPA34 in scrambled control siRNA-treated HDF in G1 that did not receive DNA damage.
Figure 3.
Figure 3.
Rad18-deficiency confers H2O2-induced ATM hyper phosphorylation specifically during G1. (A) Replicate cultures of HDF were transfected with siRNA targeting Rad18 or with a scrambled control siRNA. The control and Rad18-depleted cells were synchronized in G0, G1 and S-phase and treated with genotoxins. Cell extracts were isolated 1 h after genotoxin treatments and analysed by SDS–PAGE and immunoblotting with the indicated antibodies. (B) Replicate cultures of HDF were transfected with siRad18, synchronized in G1 and S-phase and irradiated with IR (1.5 Gy). One hour later, cell extracts were isolated and analysed by SDS–PAGE and immunoblotting with the indicated antibodies. Bands corresponding to ATM (S1981-P) in panels A and B were quantified by densitometry. In panel A, the amount of ATM (S1981-P) in each lane is expressed relative to the amount of ATM (S1981-P) in scrambled control siRNA-transfected and H2O2-treated G1 HDF. In panel B, the amount of ATM (S1981-P) in each lane is expressed relative to the amount of ATM (S1981-P) in Rad18 siRNA-transfected and IR-treated G1 HDF.
Figure 4.
Figure 4.
Depletion of PCNA or Polη recapitulates the H2O2-induced ATM hyper phosphorylation phenotype of Rad18-depleted HDF. (A) Replicate cultures of HDF were transfected with siRNA against PCNA or non-targeting control siRNA, synchronized in G1 and treated with H2O2.One hour later, cell extracts were isolated and analysed by SDS–PAGE and immunoblotting with the indicated antibodies. Bands corresponding to ATM (S1981-P) were quantified by densitometry. The amount of ATM (S1981-P) in each lane is expressed relative to the amount of ATM (S1981-P) in scrambled control siRNA-transfected HDF cells that were treated with H2O2. (B) Replicate cultures of HDF were transfected with siRNA against Polη or non-targeting control siRNA, synchronized in G1 or S-phase and treated with H2O2, UVC or ultraviolet A. After 1 h, cell extracts were isolated and analysed by SDS–PAGE and immunoblotting with the indicated antibodies. (C) Control or YFP–Polη-overexpressing cells were treated with H2O2 or UVC. One hour later, cell extracts were isolated and analysed by SDS–PAGE and immunoblotting with the indicated antibodies. The amount of ATM (S1981-P) in each lane is expressed relative to the amount of ATM (S1981-P) in control H2O2-treated cells.
Figure 5.
Figure 5.
Effect of TLS-deficiency on DSB and SSB formation and cell survival after H2O2-treatment. (A) Images from a representative alkaline comet assay showing kinetics of SSB formation and repair in H2O2-treated cells. (B) HDF were transfected with siCon, siRad18 or siPolη oligonucleotides, then synchronized and replated in replicate six-well dishes. Lysates from one plate of each replicate were analysed by SDS–PAGE and immunoblotting to validate Rad18 and Polη knockdown. Replicate cultures of siCon-, siRad18- and siPolη-transfected cells in G1 phase were treated with H2O2 (or left untreated for control samples), then harvested immediately or 1 and 18 h after H2O2 treatment for comet assays. Relative levels of SSB and DSB are shown in panels (C) and (D), respectively. (E) HDF were electroporated with siCon or siRad18 oligonucleotides, synchronized in G1 and treated with the indicated concentrations of H2O2. Clonogenic survival was determined by colony formation assays, as described under ‘Materials and Methods’ section. (F) Replicate plates of Rad18- and Polη-depleted G1-phase cells used for the survival assays shown in panel (E) were lysed and analysed by SDS–PAGE and immunoblotting to validate efficiency of Rad18 and Polη knockdowns.
Figure 6.
Figure 6.
In TLS-deficient cells, NHEJ provides a back-up pathway for preventing H2O2-induced DSB. (A) Replicate cultures of siCon-, siRad18- and siPolη-transfected cells in G1 phase were treated with 10 µM of NU7441 to inhibit DNA-PK or were left untreated for control samples. The NU7441-treated cells were then H2O2-treated (or left untreated) 4 h before harvest for neutral comet assays. (B) HDF were transfected with siCon siRad18 oligonucleotides, then synchronized in G1 and treated with NU7441 and H2O2 as described in (A). One hour after H2O2 treatment, cells were harvested, and chromatin fractions were analysed by SDS–PAGE and immunoblotting with the indicated antibodies. Bands corresponding to γH2AX were quantified by densitometry. The amount of γH2AX in each lane is expressed relative to the amount of γH2AX in scrambled control siRNA-transfected cells that were treated with H2O2 in the absence of NU7441. (C) LigIV+/+ and LigIV/ HCT116 cells were transfected with siRad18 or siCon oligonucleotides, then synchronized and treated with the indicated doses of H2O2. Survival of control and H2O2-treated cells was measured by colony formation assays. Note that the data points for LigIV+/+ and siRad18-transfected LigIV+/+ cells overlap completely. (D) Immunoblot analysis confirming reduced Rad18 expression in siRad18-transfected LigIV+/+ and LigIV/ HCT116 cells.
Figure 7.
Figure 7.
S-phase-specific roles of Rad18 in tolerance of oxidative DNA damage. (A) Velocity sedimentation profiles showing size distribution of labelled ssDNAs from control and H2O2-treated HDF. (B) YFP–Polη-expressing HDF were synchronized in S-phase and then treated with H2O2 or UVC. Representative nuclei showing the subcellular distribution of YFP–Polη under different conditions are presented. (C) Control (siCon), Rad18-depleted (siRad18) and HA-Rad18-overexpressing HDF were synchronized in S-phase and treated with H2O2 or UVC (or left untreated for control samples). One hour later, cells were lysed, and extracts were analysed by SDS–PAGE and immunoblotting with the indicated antibodies. Bands corresponding to Chk1 (S317-P) and Chk2 (T68-P) were quantified by densitometry. The amount of Chk1 (S317-P) and Chk2 (T68-P) in each lane is expressed relative to the amount of Chk1 (S317-P) and Chk2 (T68-P) in scrambled control siRNA-transfected and H2O2-treated cells. (D) HDF were electroporated with siCon or siRad18 oligonucleotides, synchronized in S-phase and treated with the indicated concentrations of H2O2. Clonogenic survival of H2O2-treated cells was determined by colony formation assays, as described under ‘Materials and Methods’ section. Replicate plates of Rad18-depleted S-phase cells used for the survival assays were lysed and analysed by SDS–PAGE and immunoblotting to validate efficiency of Rad18 and Polη knockdowns (upper panel). The experiments presented here were performed with the same synchronized cultures used for the experiment described in Figure 4E (which showed no sensitivity of Rad18-depleted cells to H2O2 treatments during G1).
Figure 8.
Figure 8.
Hypothetical model for functional redundancy of Rad18 and NHEJ in responding to oxidative DNA damage during G1. During G1, H2O2-treatment generates SSB. The exposed ssDNA is RPA-coated leading to Rad18 recruitment and PCNA mono-ubiquitinated by Rad18 at sites of repair synthesis, thereby promoting Polη recruitment. Polη facilitates gap-filling (presumably at templates containing bi-stranded and clustered damage), thereby conferring DNA damage tolerance via TLS (left). In the absence of Rad18, inefficient gap-filling by the TLS pathway leads to accumulation of DSB, which is repaired by NHEJ, also conferring DNA damage tolerance.

References

    1. Prakash S, Johnson RE, Prakash L. Eukaryotic translesion synthesis DNA polymerases: specificity of structure and function. Annu. Rev. Biochem. 2005;74:317–353. - PubMed
    1. Ohmori H, Friedberg EC, Fuchs RP, Goodman MF, Hanaoka F, Hinkle D, Kunkel TA, Lawrence CW, Livneh Z, Nohmi T, et al. The Y-family of DNA polymerases. Mol. Cell. 2001;8:7–8. - PubMed
    1. Johnson RE, Prakash S, Prakash L. Efficient bypass of a thymine-thymine dimer by yeast DNA polymerase, Poleta. Science. 1999;283:1001–1004. - PubMed
    1. Masutani C, Araki M, Yamada A, Kusumoto R, Nogimori T, Maekawa T, Iwai S, Hanaoka F. Xeroderma pigmentosum variant (XP-V) correcting protein from HeLa cells has a thymine dimer bypass DNA polymerase activity. EMBO J. 1999;18:3491–3501. - PMC - PubMed
    1. Masutani C, Kusumoto R, Yamada A, Dohmae N, Yokoi M, Yuasa M, Araki M, Iwai S, Takio K, Hanaoka F. The XPV (xeroderma pigmentosum variant) gene encodes human DNA polymerase eta. Nature. 1999;399:700–704. - PubMed

Publication types