. 2013 Aug 1;521(11):2551-69.
doi: 10.1002/cne.23298.

Cell death atlas of the postnatal mouse ventral forebrain and hypothalamus: effects of age and sex

Affiliations

Cell death atlas of the postnatal mouse ventral forebrain and hypothalamus: effects of age and sex

Todd H Ahern et al. J Comp Neurol. .

Abstract

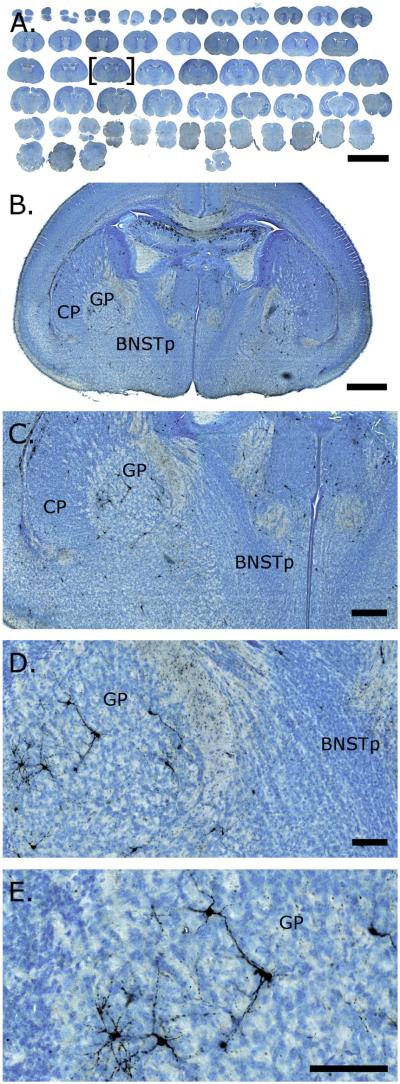
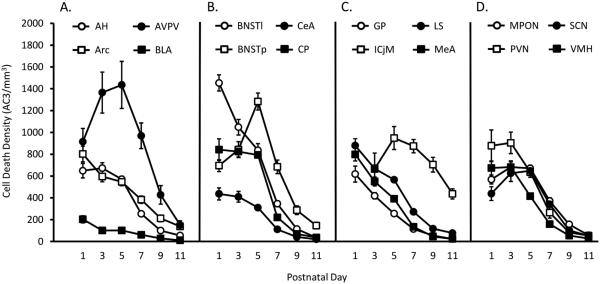
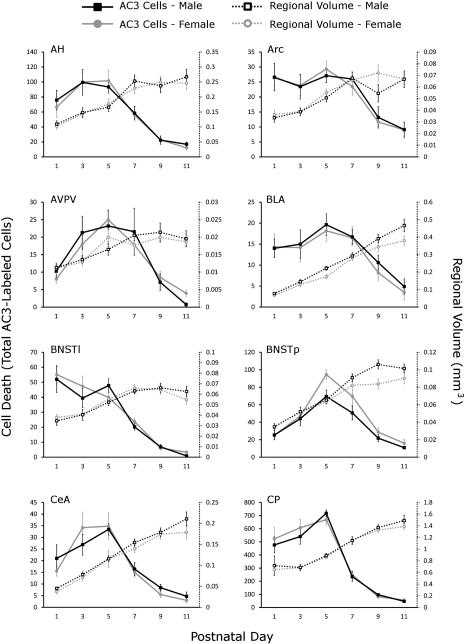
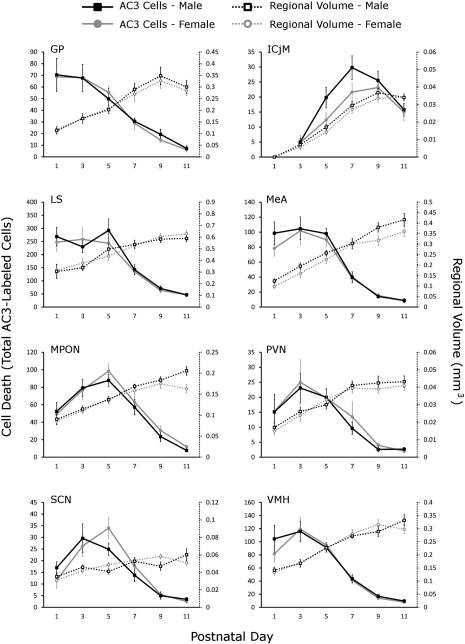
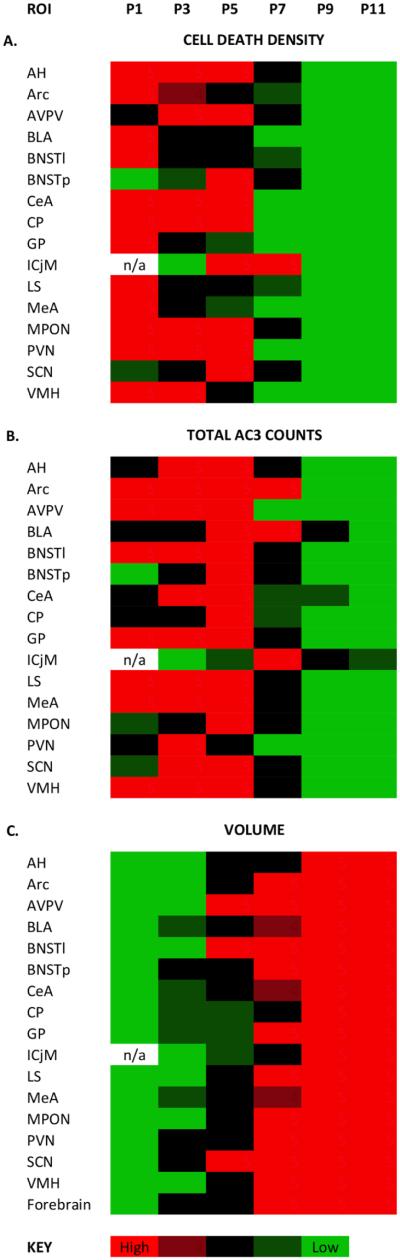
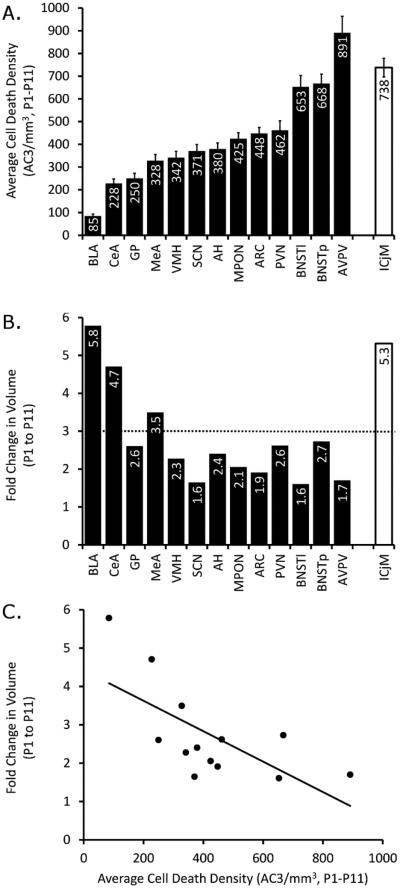
Naturally occurring cell death is essential to the development of the mammalian nervous system. Although the importance of developmental cell death has been appreciated for decades, there is no comprehensive account of cell death across brain areas in the mouse. Moreover, several regional sex differences in cell death have been described for the ventral forebrain and hypothalamus, but it is not known how widespread the phenomenon is. We used immunohistochemical detection of activated caspase-3 to identify dying cells in the brains of male and female mice from postnatal day (P) 1 to P11. Cell death density, total number of dying cells, and regional volume were determined in 16 regions of the hypothalamus and ventral forebrain (the anterior hypothalamus, arcuate nucleus, anteroventral periventricular nucleus, medial preoptic nucleus, paraventricular nucleus, suprachiasmatic nucleus, and ventromedial nucleus of the hypothalamus; the basolateral, central, and medial amygdala; the lateral and principal nuclei of the bed nuclei of the stria terminalis; the caudate-putamen; the globus pallidus; the lateral septum; and the islands of Calleja). All regions showed a significant effect of age on cell death. The timing of peak cell death varied between P1 to P7, and the average rate of cell death varied tenfold among regions. Several significant sex differences in cell death and/or regional volume were detected. These data address large gaps in the developmental literature and suggest interesting region-specific differences in the prevalence and timing of cell death in the hypothalamus and ventral forebrain.


Figures

Figure 1
Figure 1
Activated caspase-3 (AC3) immunoreactivity in digitally scanned brain sections from a postnatal day 1 mouse. Brains were labeled for AC3 and counterstained with thionin to assist in the identification of structures. Slides were digitally scanned, then images were opened and captured in ImageScope (Aperio). A depicts a low-power view of the entire scanned slide. B–E are progressively higher magnifications of the section marked by brackets in A. AC3-positive cells are clearly identifiable. Scale bars = 6 mm in A; 500 μm in B; 200 μm in C; 100 μm in D,E.
Figure 2
Figure 2
Immunohistochemistry for activated caspase-3 (AC3) in wild-type (Bax+/+) and Bax knockout (Bax−/−) mice on postnatal day 2. Numerous AC3-labeled (black) cells are seen at all rostral–caudal levels of the forebrain in Bax+/+ mice (A–C depict progressively more caudal sections of the same brain), whereas there is a near-elimination of this labeling in Bax−/− mice (D–F). The few AC3-labeled cells remaining in Bax−/− mice were found in the ventral cingulate cortex and corpus callosum region (D) and adjacent to the lateral ventricles (D–F). Scale bar = 1 mm.
Figure 3
Figure 3
Cell death density in 16 regions of the hypothalamus and ventral forebrain from postnatal days 1 to 11. Cell death density (number of activated caspase-3 [AC3]-labeled cells/mm3) was measured on six postnatal days (P1, P3, P5, P7, P9, P11) in 16 regions of interest (ROIs). ROIs were grouped alphabetically and for ease of visualization are depicted in four separate graphs. A: Anterior hypothalamus (AH), arcuate nucleus (Arc), anteroventral periventricular nucleus (AVPV), and basolateral amygdala (BLA). B: Bed nucleus of the stria terminalis, lateral nucleus (BNSTl), bed nucleus of the stria terminalis, principal nucleus (BNSTp), central nucleus of the amygdala (CeA), and caudate-putamen (CP). C: Globus pallidus (GP), islands of Calleja, major (ICjM), lateral septum (LS), and medial amygdala (MeA). D: Medial preoptic nucleus (MPON), paraventricular nucleus of the hypothalamus (PVN), suprachiasmatic nucleus (SCN), and ventromedial nucleus of the hypothalamus (VMH).
Figure 4
Figure 4
Total number of activated caspase-3-labeled cells and regional volume by age and sex in 16 regions of interest. The total number of activated caspase-3 (AC3)-labeled cells (solid lines, y-axis on left) and the regional volume (dotted lines, y-axis on right) were graphed by sex (males in black, females in gray) and ordered alphabetically. For abbreviations see list.
Figure 4
Figure 4
Total number of activated caspase-3-labeled cells and regional volume by age and sex in 16 regions of interest. The total number of activated caspase-3 (AC3)-labeled cells (solid lines, y-axis on left) and the regional volume (dotted lines, y-axis on right) were graphed by sex (males in black, females in gray) and ordered alphabetically. For abbreviations see list.
Figure 5
Figure 5
Heat maps of cell death density, total cell death, and regional volume changes with age in 16 regions of interest. Within each region, data for males and females were combined, and Tukey’s post hoc tests were used to compare cell death density (A), total number of activated caspase-3 (AC3)-labeled cells (B), or regional volume across ages (C). Ages with values that did not differ significantly from each other are the same color. High values are red, and progressively lower values move through black to green. P, postnatal day; ROI, region of interest; n/a, not assessed. See Materials and Methods for additional details.
Figure 6
Figure 6
Average cell death density and increases in volume vary by region and are negatively correlated. A: Cell death density averaged over both sex and age (P1, P3, P5, P7, P9, and P11) was calculated for each region of interest, and regions are ordered from lowest to highest density (left to right). The islands of Calleja (ICjM; white bar at right) is set apart because it was not discernible until P3; its average is based on P3–P11. B: The fold change in volume was also calculated and graphed, following the order of ROIs found in A. The dotted line indicates the fold change in “whole forebrain” volume from P1–P11. C: Average density and volume fold change were significantly negatively correlated (Pearson’s R = −0.672, P = 0.012).
Figure 7
Figure 7
The BNSTp, ICjM, and the calbindin-defined SDN-POA exhibit sex differences in cell death density across P5–P7. Females show greater rates of cell death in the principal nucleus of bed nucleus of the stria terminalis (BNSTp; P < 0.001; A) and sexually dimorphic nucleus of the preoptic area (SDN-POA; P = 0.013; C), whereas males show significantly greater rates in the islands of Calleja (ICjM; P = 0.026; B).

References

    1. Adams SM, de Rivero Vaccari JC, Corriveau RA. Pronounced cell death in the absence of NMDA receptors in the developing somatosensory thalamus. J Neurosci. 2004;24:9441–9450. - PMC - PubMed
    1. Bayer SA, Altman J. Development of the preoptic area: time and site of origin, migratory routes, and settling patterns of its neurons. J Comp Neurol. 1987;265:65–95. - PubMed
    1. Berdel B, Moryś J, Maciejewska B, Dziewiatkowski J. Volume and topographical changes of the basolateral complex during the development of the rat’s amygdaloid body. Fol Morphol. 1997;56:1–11. - PubMed
    1. Blaschke AJ, Staley K, Chun J. Widespread programmed cell death in proliferative and postmitotic regions of the fetal cerebral cortex. Development. 1996;122:1165–1174. - PubMed
    1. Blaschke AJ, Weiner JA, Chun J. Programmed cell death is a universal feature of embryonic and postnatal neuroproliferative regions throughout the central nervous system. J Comp Neurol. 1998;396:39–50. - PubMed

Publication types

MeSH terms