

Coarse grained normal mode analysis vs. refined Gaussian Network Model for protein residue-level structural fluctuations
- PMID: 23296997
- PMCID: PMC4373625
- DOI: 10.1007/s11538-012-9797-y
Coarse grained normal mode analysis vs. refined Gaussian Network Model for protein residue-level structural fluctuations
Abstract
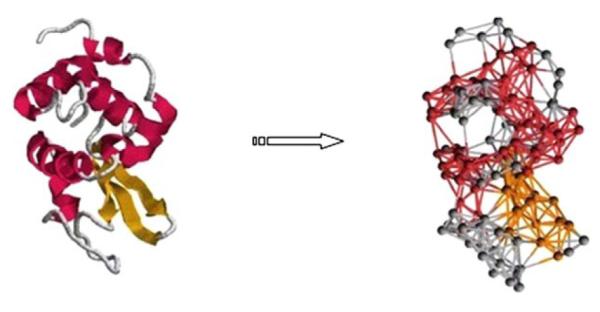
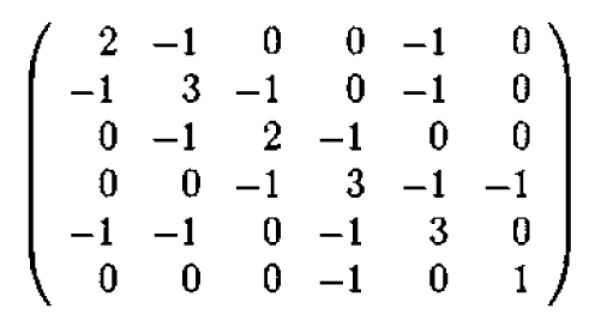
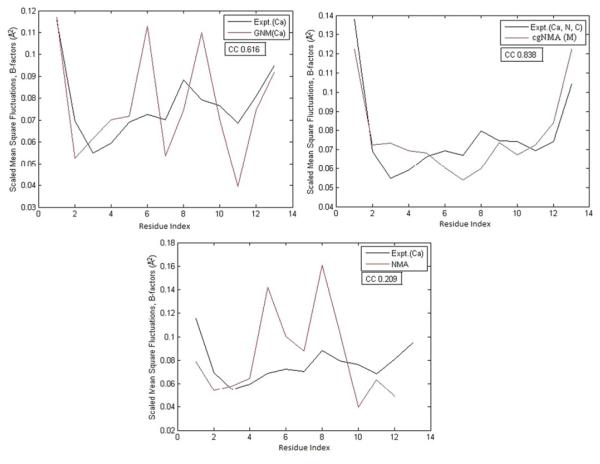
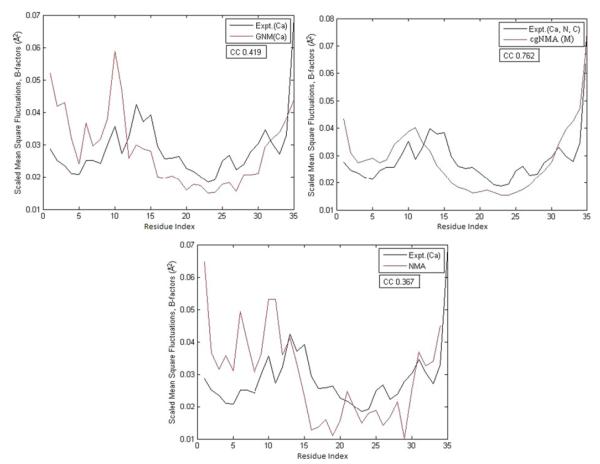
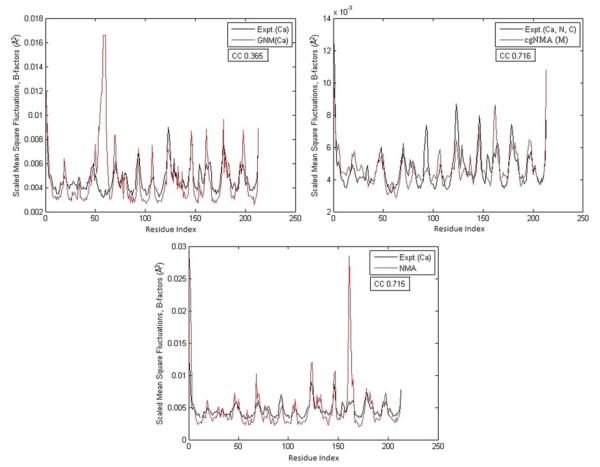
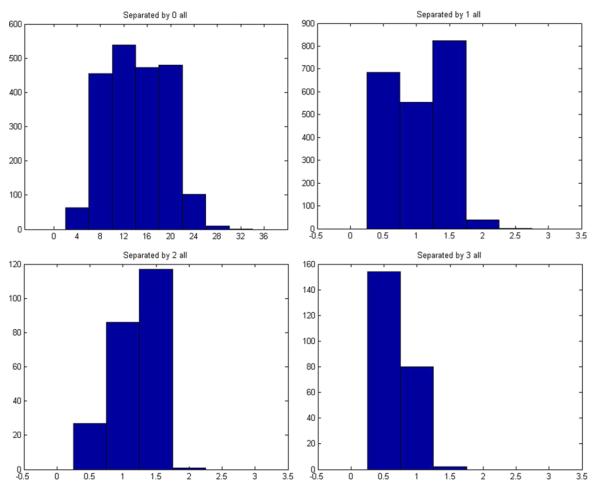
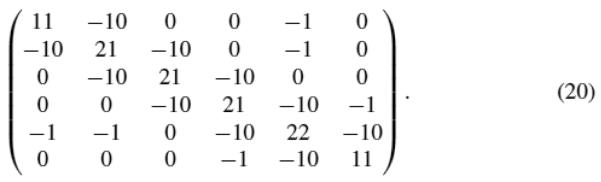
We investigate several approaches to coarse grained normal mode analysis on protein residual-level structural fluctuations by choosing different ways of representing the residues and the forces among them. Single-atom representations using the backbone atoms C(α), C, N, and C(β) are considered. Combinations of some of these atoms are also tested. The force constants between the representative atoms are extracted from the Hessian matrix of the energy function and served as the force constants between the corresponding residues. The residue mean-square-fluctuations and their correlations with the experimental B-factors are calculated for a large set of proteins. The results are compared with all-atom normal mode analysis and the residue-level Gaussian Network Model. The coarse-grained methods perform more efficiently than all-atom normal mode analysis, while their B-factor correlations are also higher. Their B-factor correlations are comparable with those estimated by the Gaussian Network Model and in many cases better. The extracted force constants are surveyed for different pairs of residues with different numbers of separation residues in sequence. The statistical averages are used to build a refined Gaussian Network Model, which is able to predict residue-level structural fluctuations significantly better than the conventional Gaussian Network Model in many test cases.
Figures
References
-
- Ahmed A, Gohlke H. Multiscale modeling of macromolecular conformational changes combining concepts from rigidity and elastic network theory. Proteins. 2006;63:1038–1051. - PubMed
-
- Bahar I, Atilgan AR, Erman B. Direct evaluation of thermal fluctuations in proteins using a single-parameter harmonic potential, folding. Design. 1997;2:173–181. - PubMed
-
- Bahar I, Atilgan AR, Demirel M, Erman B. Vibrational dynamics of folded proteins: significance of slow and fast motions in relation to function and stability. Phys. Rev. Lett. 1998;80:2733–2736.
-
- Berg JM, Tymoczko JL, Stryer L. Biochemistry. Freeman; New York: 2006.
-
- Berman H, et al. Pdb data bank annual report. 2010 http://www.rcsb.orgpdb.
Publication types
MeSH terms
Substances
Grants and funding
LinkOut - more resources
Full Text Sources
Other Literature Sources
