. 2013 Feb 6;105(3):175-201.
doi: 10.1093/jnci/djs491. Epub 2013 Jan 7.

Annual Report to the Nation on the Status of Cancer, 1975-2009, featuring the burden and trends in human papillomavirus(HPV)-associated cancers and HPV vaccination coverage levels

Affiliations

Annual Report to the Nation on the Status of Cancer, 1975-2009, featuring the burden and trends in human papillomavirus(HPV)-associated cancers and HPV vaccination coverage levels

Ahmedin Jemal et al. J Natl Cancer Inst. .

Abstract

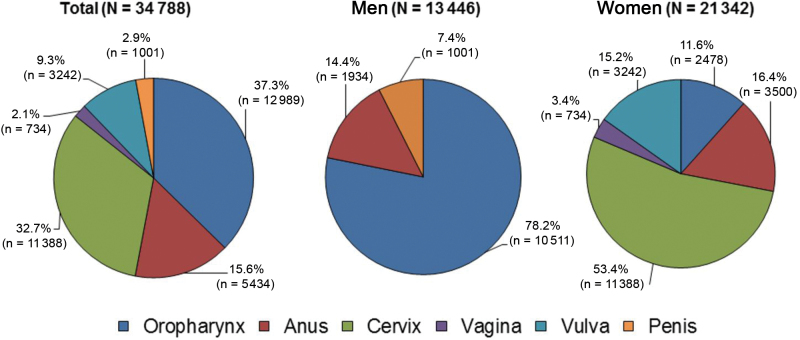
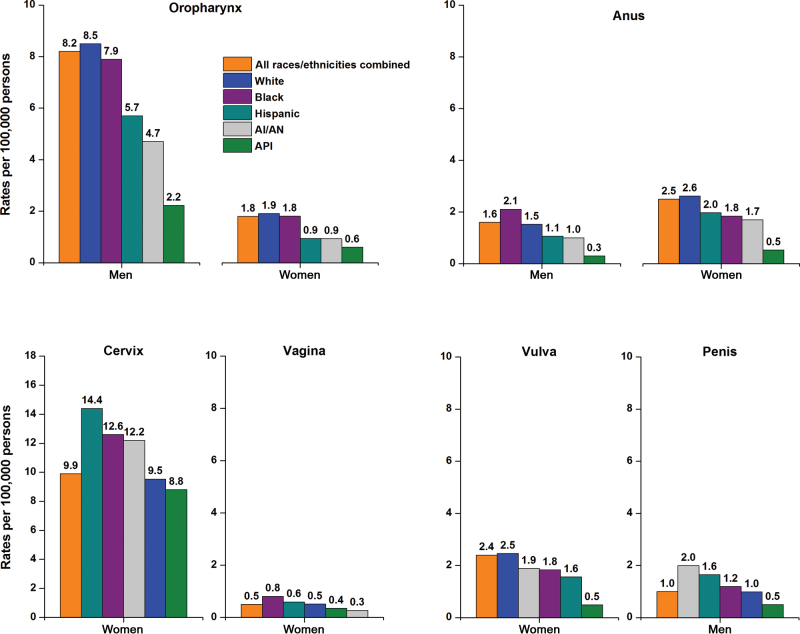
Background: The American Cancer Society (ACS), the Centers for Disease Control and Prevention (CDC), the National Cancer Institute (NCI), and the North American Association of Central Cancer Registries (NAACCR) collaborate annually to provide updates on cancer incidence and death rates and trends in these outcomes for the United States. This year's report includes incidence trends for human papillomavirus (HPV)-associated cancers and HPV vaccination (recommended for adolescents aged 11-12 years).

Methods: Data on cancer incidence were obtained from the CDC, NCI, and NAACCR, and data on mortality were obtained from the CDC. Long- (1975/1992-2009) and short-term (2000-2009) trends in age-standardized incidence and death rates for all cancers combined and for the leading cancers among men and among women were examined by joinpoint analysis. Prevalence of HPV vaccination coverage during 2008 and 2010 and of Papanicolaou (Pap) testing during 2010 were obtained from national surveys.

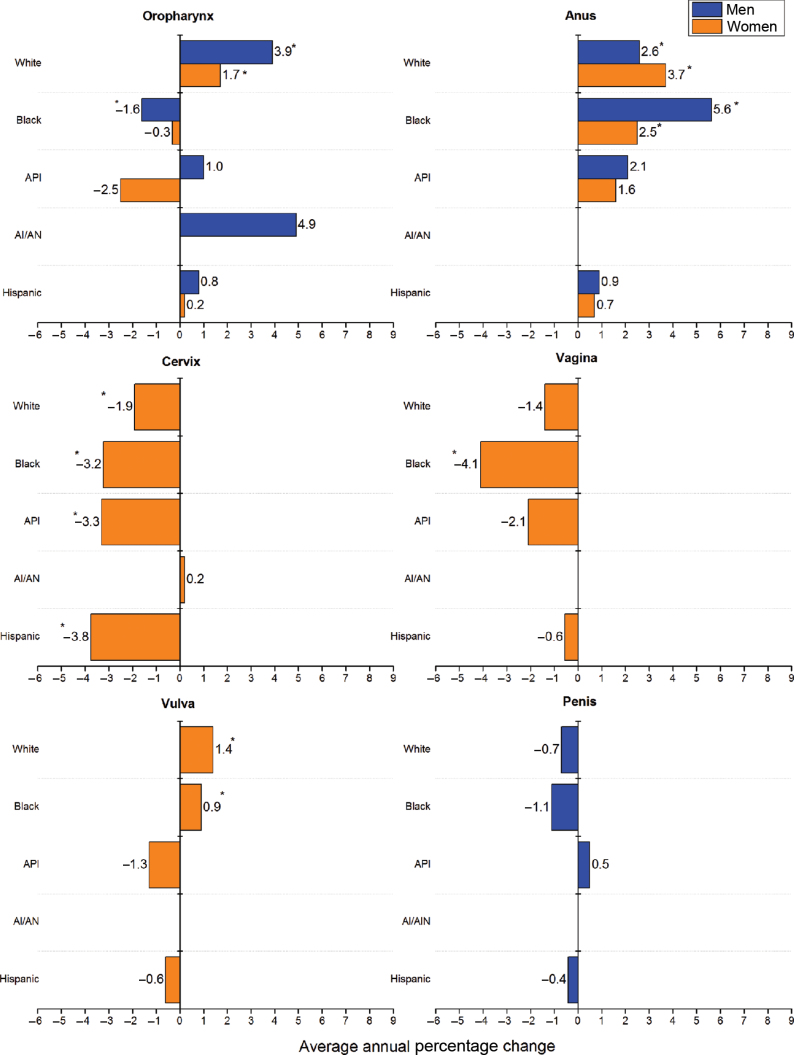
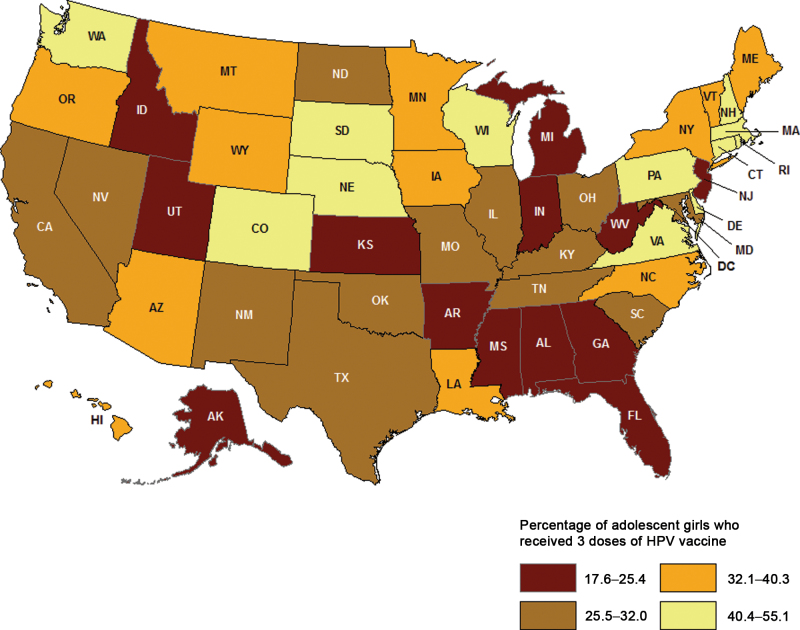
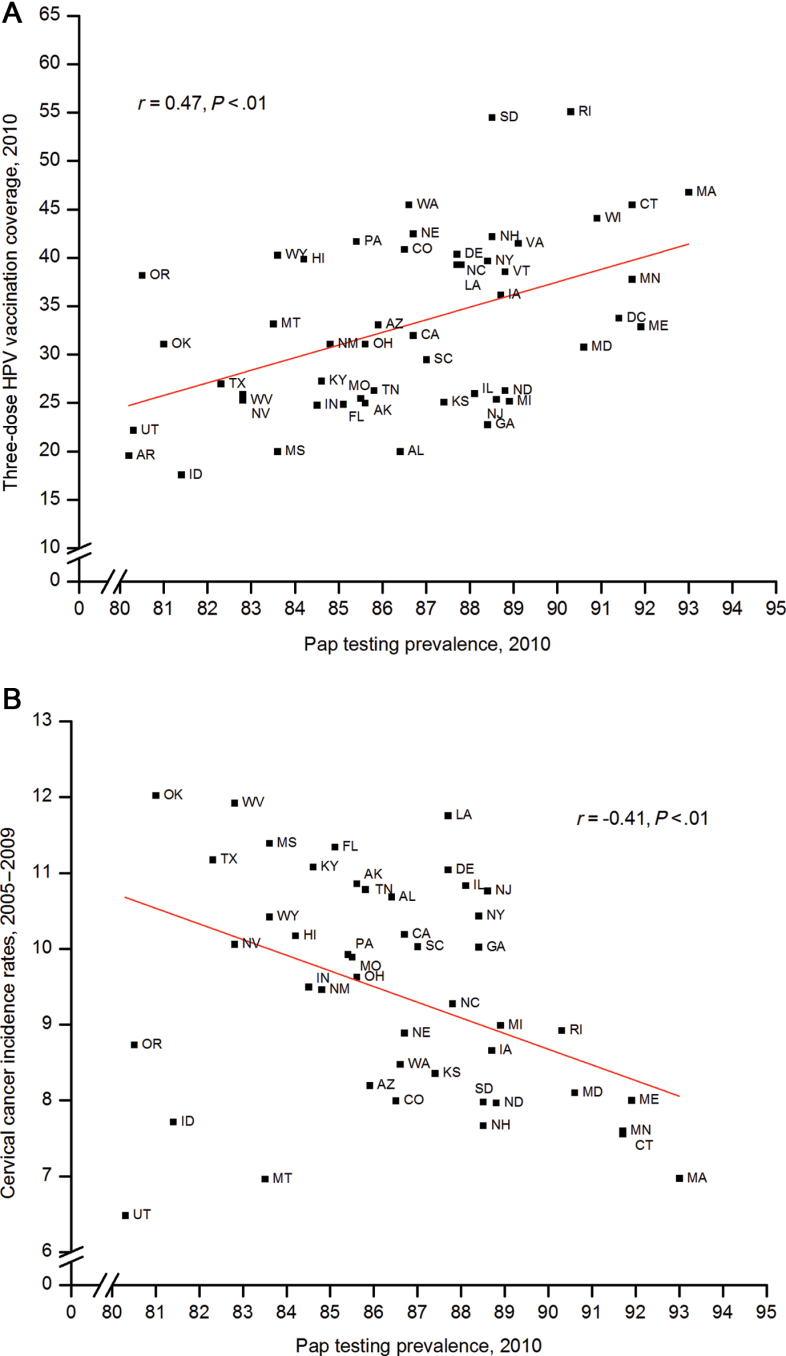
Results: Death rates continued to decline for all cancers combined for men and women of all major racial and ethnic groups and for most major cancer sites; rates for both sexes combined decreased by 1.5% per year from 2000 to 2009. Overall incidence rates decreased in men but stabilized in women. Incidence rates increased for two HPV-associated cancers (oropharynx, anus) and some cancers not associated with HPV (eg, liver, kidney, thyroid). Nationally, 32.0% (95% confidence interval [CI] = 30.3% to 33.6%) of girls aged 13 to 17 years in 2010 had received three doses of the HPV vaccine, and coverage was statistically significantly lower among the uninsured (14.1%, 95% CI = 9.4% to 20.6%) and in some Southern states (eg, 20.0% in Alabama [95% CI = 13.9% to 27.9%] and Mississippi [95% CI = 13.8% to 28.2%]), where cervical cancer rates were highest and recent Pap testing prevalence was the lowest.

Conclusions: The overall trends in declining cancer death rates continue. However, increases in incidence rates for some HPV-associated cancers and low vaccination coverage among adolescents underscore the need for additional prevention efforts for HPV-associated cancers, including efforts to increase vaccination coverage.


Figures

Figure 1.
Figure 1.
Number of new human papillomavirus (HPV)–associated cancers overall, and by sex, in the United States, 2009. Source: National Program of Cancer Registries and Surveillance, Epidemiology, and End Results areas reported by the North American Association of Central Cancer Registries as meeting high-quality incidence data standards for the specified time period. Note that the number of cancer cases underestimates the actual number of cases occurring because of incomplete coverage of population-based registries in 2009 (93%). HPV-associated cancers are defined as cancers at specific anatomic sites and with specific cellular types in which HPV DNA frequently is found. Some of these cancers may not necessarily be HPV-positive because no testing was conducted. Virtually all cervical cancers are due to HPV infection, along with 90% of anal cancers, more than 60% of certain subsites of oropharyngeal cancers, and approximately 40% of vagina, vulva, and penile cancers.
Figure 2.
Figure 2.
Age-adjusted incidence rates for human papillomavirus (HPV)–associated cancers in the United States by sex and race and ethnicity, 2005 to 2009. The scale of the y axis differs for cervical cancer. The rates for the period from 2005 to 2009 for the five major racial and ethnic groups are from 47 states: Alabama, Alaska, Arizona, California, Colorado, Connecticut, Delaware, Florida, Georgia, Hawaii, Idaho, Illinois, Indiana, Iowa, Kansas, Kentucky, Louisiana, Maine, Maryland, Massachusetts, Michigan, Minnesota, Mississippi, Missouri, Montana, Nebraska, Nevada, New Hampshire, New Jersey, New Mexico, New York, North Carolina, North Dakota, Ohio, Oklahoma, Oregon, Pennsylvania, Rhode Island, South Carolina, South Dakota, Tennessee, Texas, Utah, Vermont, Washington, West Virginia, Wyoming. Source: National Program of Cancer Registries and Surveillance, Epidemiology, and End Results areas reported by the North American Association of Central Cancer Registries as meeting high-quality incidence data standards for the specified time period. HPV-associated cancers are defined as cancers at specific anatomic sites and with specific cellular types in which HPV DNA frequently is found. Some of these cancers may not necessarily be HPV-positive because no testing was conducted. White, black, Asian/Pacific Islander (API), and American Indian/Alaska Native (AI/AN) (IHS Contract Health Services Delivery Area counties) include Hispanic and non-Hispanic; the race and ethnicity categories are not mutually exclusive.
Figure 3.
Figure 3.
Trends in age-adjusted human papillomavirus (HPV)–associated cancer incidence rates by sex and race and ethnicity in the United States, 2000 to 2009. An asterisk indicates average annual percentage change was statistically significantly different from zero at P less than .05. Trends could not be determined for American Indians/Alaska Natives (AI/ANs) for cancers of anus, vagina, vulva, and penis because of sparse data. The rates for the period from 2005 to 2009 for the five major racial and ethnic groups are from 42 states: Alabama, Alaska, Arizona, California, Colorado, Connecticut, Delaware, Florida, Georgia, Hawaii, Idaho, Illinois, Indiana, Iowa, Kentucky, Louisiana, Maine, Maryland, Massachusetts, Michigan, Minnesota, Missouri, Montana, Nebraska, Nevada, New Hampshire, New Jersey, New Mexico, New York, North Dakota, Ohio, Oklahoma, Oregon, Pennsylvania, Rhode Island, South Carolina, Texas, Utah, Vermont, Washington, West Virginia, Wyoming. Source: National Program of Cancer Registries and Surveillance, Epidemiology, and End Results areas reported by the North American Association of Central Cancer Registries as meeting high-quality incidence data standards for the specified time period. HPV-associated cancers are defined as cancers at specific anatomic sites and with specific cellular types in which HPV DNA frequently is found. Some of these cancers may not necessarily be HPV-positive because no testing was conducted. White, black, Asian/Pacific Islander (API), and AI/AN (IHS Contract Health Services Delivery Area counties) include Hispanic and non-Hispanic; the race and ethnicity categories are not mutually exclusive.
Figure 4.
Figure 4.
Three-dose human pappilomavirus (HPV) vaccination coverage among girls (aged 13 to 17 years), by state, in the United States, 2010. Source: National Immunization Survey-Teen (NIS-Teen) 2010, National Center for Health Statistics, Centers for Disease Control and Prevention, 2011. Girls in the 2010 NIS-Teen were born during the period from January 1992 to February 1998 and received either quadrivalent or bivalent human papillomavirus vaccine (some girls received more than three doses).
Figure 5.
Figure 5.
Scatter plots of human pappilomavirus (HPV) vaccination coverage levels (A) and cervical cancer incidence rates (B) by Papanicolao (Pap) testing prevalence by state. P values were obtained by a two-sided t test. r, Pearson correlation coefficient. Three-dose HPV vaccination coverage levels are reported for adolescent girls in the 2010 National Immunization Survey-Teen (NIS-Teen) who were born during the period from January 1992 to February 1998. Girls may have received either quadrivalent or bivalent HPV vaccine. Source: National Immunization Survey-Teen 2008, 2010, National Center for Health Statistics, Centers for Disease Control and Prevention, 2010, 2011. Five-year cervical cancer incidence rates during the period from 2005 to 2009 for women aged 15 years or older are per 100,000 population and standardized to the 2000 US standard population. States with missing rates did not meet North American Association of Central Cancer Registries (NAACCR) quality standards for the specified years and are not included in the reporting of incidence. Source: National Program of Cancer Registries and Surveillance, Epidemiology, and End Results Program reported by NAACCR as meeting high-quality incidence data standards for the specified time periods. Percentage of women aged 21 to 65 years with intact uteri who received a Pap test in the previous 3 years in 2010. Source: Behavioral Risk Factor Surveillance System Public Use Data Tape 2010, National Center for Chronic Disease Prevention and Health Promotion, Centers for Disease Control and Prevention, 2011.

Comment in

References

    1. Wingo PA, Ries LA, Rosenberg HM, et al. Cancer incidence and mortality, 1973–1995: a report card for the U.S. Cancer. 1998; 82(6):1197–1207 - PubMed
    1. Wingo PA, Ries LA, Giovino GA, et al. Annual report to the nation on the status of cancer, 1973–1996, with a special section on lung cancer and tobacco smoking. J Natl Cancer Inst. 1999; 91(8):675–690 - PubMed
    1. Ries LA, Wingo PA, Miller DS, et al. The annual report to the nation on the status of cancer, 1973–1997, with a special section on colorectal cancer. Cancer. 2000; 88(10):2398–2424 - PubMed
    1. Howe HL, Wingo PA, Thun MJ, et al. Annual report to the nation on the status of cancer (1973 through 1998), featuring cancers with recent increasing trends. J Natl Cancer Inst. 2001; 93(11):824–842 - PubMed
    1. Edwards BK, Howe HL, Ries LA, et al. Annual report to the nation on the status of cancer, 1973–1999, featuring implications of age and aging on U.S. cancer burden. Cancer. 2002; 94(10):2766–2792 - PubMed

Publication types

MeSH terms

Substances