

Genomic basis for coral resilience to climate change
- PMID: 23297204
- PMCID: PMC3557039
- DOI: 10.1073/pnas.1210224110
Genomic basis for coral resilience to climate change
Abstract
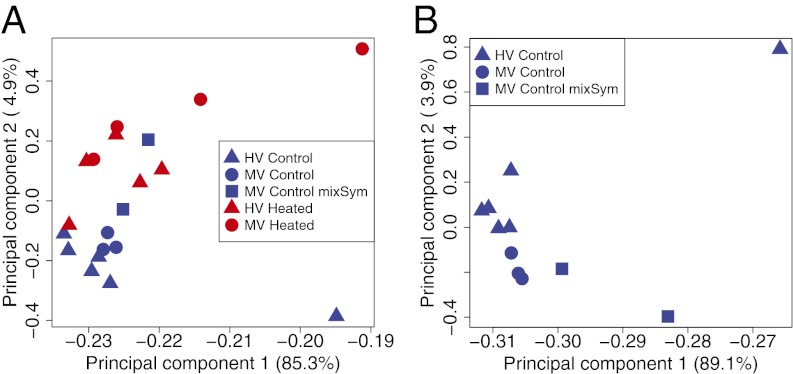
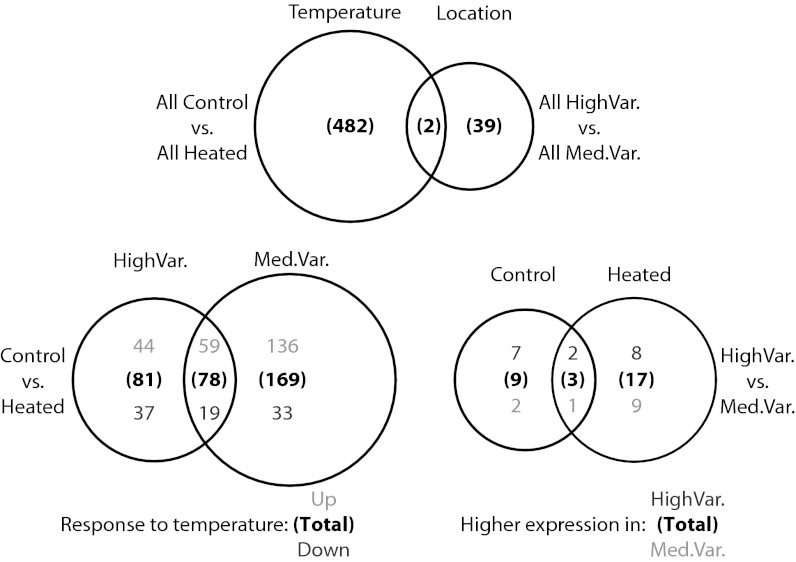
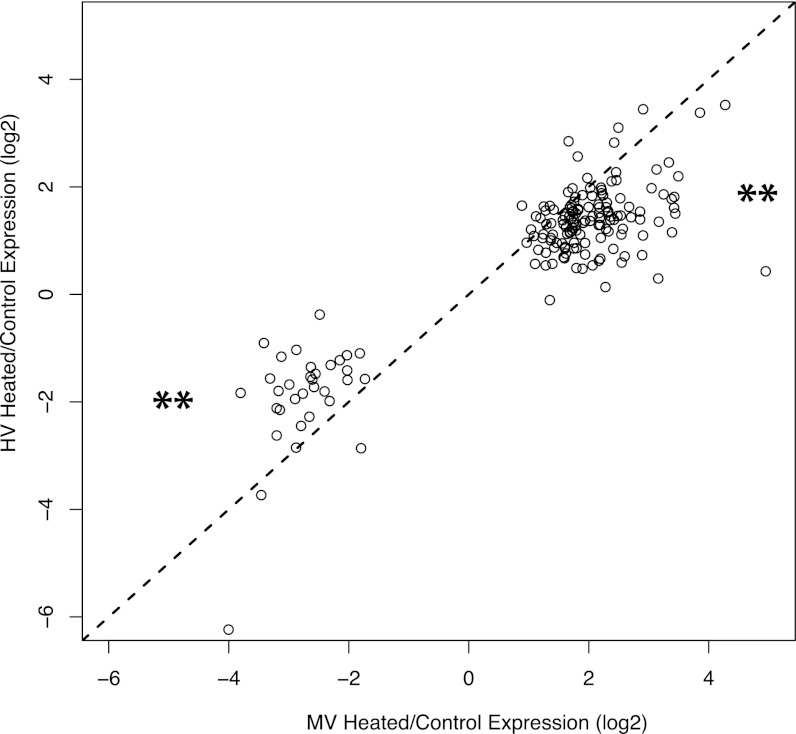
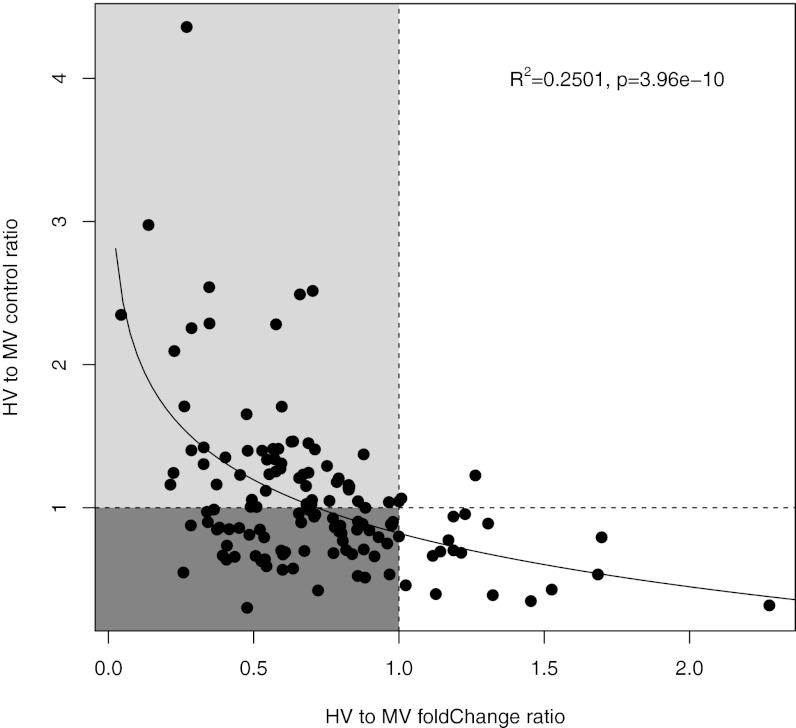
Recent advances in DNA-sequencing technologies now allow for in-depth characterization of the genomic stress responses of many organisms beyond model taxa. They are especially appropriate for organisms such as reef-building corals, for which dramatic declines in abundance are expected to worsen as anthropogenic climate change intensifies. Different corals differ substantially in physiological resilience to environmental stress, but the molecular mechanisms behind enhanced coral resilience remain unclear. Here, we compare transcriptome-wide gene expression (via RNA-Seq using Illumina sequencing) among conspecific thermally sensitive and thermally resilient corals to identify the molecular pathways contributing to coral resilience. Under simulated bleaching stress, sensitive and resilient corals change expression of hundreds of genes, but the resilient corals had higher expression under control conditions across 60 of these genes. These "frontloaded" transcripts were less up-regulated in resilient corals during heat stress and included thermal tolerance genes such as heat shock proteins and antioxidant enzymes, as well as a broad array of genes involved in apoptosis regulation, tumor suppression, innate immune response, and cell adhesion. We propose that constitutive frontloading enables an individual to maintain physiological resilience during frequently encountered environmental stress, an idea that has strong parallels in model systems such as yeast. Our study provides broad insight into the fundamental cellular processes responsible for enhanced stress tolerances that may enable some organisms to better persist into the future in an era of global climate change.
Conflict of interest statement
The authors declare no conflict of interest.
Figures
References
-
- de Nadal E, Ammerer G, Posas F. Controlling gene expression in response to stress. Nat Rev Genet. 2011;12(12):833–845. - PubMed
-
- Ingram J, Bartels D. The molecular basis of dehydration tolerance in plants. Annu Rev Plant Physiol Plant Mol Biol. 1996;47:377–403. - PubMed
-
- Somero GN. Thermal physiology and vertical zonation of intertidal animals: Optima, limits, and costs of living. Integr Comp Biol. 2002;42(4):780–789. - PubMed
-
- Hochachka PW, Somero GN. Biochemical Adaptation: Mechanism and Process in Physiological Evolution. New York: Oxford Univ. Press; 2002.
-
- Huey RB, Kingsolver JG. Evolution of resistance to high-temperatures in ectotherms. Am Nat. 1993;142(Suppl):S21–S46.
Publication types
MeSH terms
LinkOut - more resources
Full Text Sources
Other Literature Sources
Medical
