. 2013 Jan 22;110(4):1530-5.
doi: 10.1073/pnas.1205756110. Epub 2013 Jan 7.

Noncanonical GPCR signaling arising from a PTH receptor-arrestin-Gβγ complex

Affiliations

Noncanonical GPCR signaling arising from a PTH receptor-arrestin-Gβγ complex

Vanessa L Wehbi et al. Proc Natl Acad Sci U S A. .

Abstract

G protein-coupled receptors (GPCRs) participate in ubiquitous transmembrane signal transduction processes by activating heterotrimeric G proteins. In the current "canonical" model of GPCR signaling, arrestins terminate receptor signaling by impairing receptor-G-protein coupling and promoting receptor internalization. However, parathyroid hormone receptor type 1 (PTHR), an essential GPCR involved in bone and mineral metabolism, does not follow this conventional desensitization paradigm. β-Arrestins prolong G protein (G(S))-mediated cAMP generation triggered by PTH, a process that correlates with the persistence of arrestin-PTHR complexes on endosomes and which is thought to be associated with prolonged physiological calcemic and phosphate responses. This presents an inescapable paradox for the current model of arrestin-mediated receptor-G-protein decoupling. Here we show that PTHR forms a ternary complex that includes arrestin and the Gβγ dimer in response to PTH stimulation, which in turn causes an accelerated rate of G(S) activation and increases the steady-state levels of activated G(S), leading to prolonged generation of cAMP. This work provides the mechanistic basis for an alternative model of GPCR signaling in which arrestins contribute to sustaining the effect of an agonist hormone on the receptor.


Conflict of interest statement

The authors declare no conflict of interest.

Figures

Fig. 1.
Fig. 1.
Signaling models of GPCR. (A) Classical model. A ligand binds the inactive state of a GPCR and stabilizes its active form, which then couples with heterotrimeric G proteins (Gαβγ) through a diffusion-controlled process (step 1). The L–R*–G complex in turn catalyzes GDP–GTP exchange on Gα, leading to dissociation of the GTP-bound Gα (Gα-GTP) along with the Gβγ dimer from the receptor (step 2). In the case of GS, Gα-GTP activates specific effectors such as adenylyl cyclases (AC), which catalyze the synthesis of cAMP from ATP (step 3). The hydrolysis of GTP to GDP causes the dissociation of GαS from adenylyl cyclases, shutting down cAMP production and its reassociation to Gβγ subunits (step 4). In this model, the recruitment of β-arrestin mediates desensitization of G-protein signaling. (B) Noncanonical model. (1) A long-lived PTH–PTHR–arrestin complex could contribute to sustained cAMP signaling by stabilizing an interaction with the active state of GS. (2) Alternatively, the interaction between the activated PTHR and GS is stabilized by β-arrestins. After the first round of activation, step 1 is bypassed, such that free Gα-GDP directly reassociates with PTHR–Gβγ complexes to initiate a new cycle of G-protein activation. Arrestin stabilizes the G-protein cycle, resulting in prolonged cAMP production.
Fig. 2.
Fig. 2.
Formation of a ternary PTHR–arrestin–Gβγ complex by PTH. (A) Time-resolved changes in emission of CFP and YFP fluorescence (F, normalized to the initial value F0) in single HEK293 cells stably expressing PTHR and transiently expressing β-arr2YFP and GβγCFP (Left, n = 10). Shown are the changes induced by rapid superfusion with 100 nM PTH(1–34) (arrows). Control experiments were done in cells expressing PTHR, β-arr2YFP, and CFPPM (Right, n = 14). Data are the mean ± SEM. (B) Examples of averaged autocorrelation curves from ICCS experiments for GβγCFP and β-arr2YFP before (Left) and after (Center) PTH(1–34) stimulation was used to calculate fractional binding (Right) for either GβγCFP/β-arr2YFP or V2RCFP/β-arr2YFP after PTH(1–34) challenge. Data are the mean ± SEM of n = 6 (*P < 0.05, **P < 0.01). (C) HEK293 cells were transiently transfected with PTHRGFP, GβγCFP, or with (Center) or without (Left) β-arr1[IV-AA]Tom. (Left) Recovery of CFP fluorescence before (black curve, n = 15) or after (gray curve, n = 4) addition of PTH(1–34) and under control conditions in cells expressing PTHRGFP and CFPPM after addition of PTH(1–34) (blue curve, n = 20). (Center) Recovery of CFP in the absence (black curve, n = 7) or presence of PTH(1–34). The gray curve shows the recovery of CFP (n = 7), whereas the red curve indicates the recovery of Tomato fluorescence (n = 5) after addition of PTH(1–34). Note that fluorescence was bleached using a laser focused on the cell-membrane area containing PTHR-GFP and β-arr1[IV-AA]Tom as visualized by confocal microscope (Left, Upper). Data were used to calculate recovered fluorescence of CFP 60 s after photobleaching (F60, Right) (*P < 0.05, **P < 0.01). Data are the mean ± SEM.
Fig. 3.
Fig. 3.
Kinetics of PTHR–Gβγ interaction modulated by β-arrestins. (A) Time courses of PTHR and Gβγ association/dissociation recorded by changes of the normalized FRET (NFRET) ratio FYFP:FCFP in HEK293 cells stably expressing PTHRYFP and transiently expressing Gβ1γ2CFP without (control) or with β-arrestin 2, β-arrestin 1, or β-arr1[IV-AA] overexpression. Measurements were performed in single cells continuously perfused with control buffer or M-PTH(1–34) (3 μM) for the times indicated by the horizontal bar as previously described (2). (Right) Corresponding averaged time courses for PTHR–Gβγ dissociation. Data are the mean ± SEM of n = 18 (control), n = 11 (β-arr2), n = 16 (β-arr1), and n = 16 (β-arr1[IV-AA]). (B) Similar experiments as in A where cells were transfected with either siRNA targeting human β-arrestin 1 and β-arrestin 2 (si-β-arr1/2) or scrambled siRNA (control). Data represent the mean ± SEM of four independent experiments; n = 6 (control) and n = 12 (si-β-arr1/2) cells. (C and D) Quantification of the change in FRET induced by M-PTH(1–14) in experiments shown in A and B. *P < 0.05, **P < 0.01 when comparing the values obtained for control versus β-arr1, β-arr2, or β-arr1[IV-AA] overexpression, or siRNA-control versus siRNA-β-arr1/2.
Fig. 4.
Fig. 4.
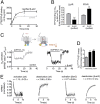
Consequences of a ternary PTHR–arrestin–Gβγ complex on GS activation. (A) Time courses of PTH(1–34)–stimulated [35S]GTPγS binding to membrane preparations of HEK293 cells stably expressing PTHR in the absence (gray curve) or presence (black curve) of purified β-arrestin 2 (100 nM). Data are the mean ± SEM of n = 3 experiments. (B) Quantification of [35S]GTPγS binding results shown in A. Control experiments were done with 10 μM ISO. Bars represent the mean ± SEM of n = 3 (GTPγS binding) (**P < 0.01, ***P < 0.001). (C) Examples of the time course of GS activation measured by FRET in HEK293 cells stably expressing PTHR and transiently expressing GSCFP/YFP (GαS-YFP/Gβ1/Gγ2-CFP) with (Right) or without (Left) overexpression of β-arrestin 2. Measurements were performed in single cells continuously perfused with buffer or briefly perfused with M-PTH(1–14) (3 μM) for the time indicated by the horizontal bar, as previously described (2, 7). GS activation is associated with a decrease in FRET signal. (D) Quantification of G-protein activation measured by FRET with GSCFP/YFP as shown in C. Bars represent the mean ± SEM of n = 9 (β-arr2) and n = 4 (β-arr1) experiments (**P < 0.01). (E) Averaged time courses of GS activation/deactivation corresponding to experiments shown in C. Data are the mean ± SEM of n = 8 (control) and n = 9 (β-arr2) experiments.
Fig. 5.
Fig. 5.
Arrestin control of cAMP mediated by PTHR. (A) Averaged cAMP response over 25 min measured by FRET changes from HEK293 cells stably expressing PTHR and transiently expressing a cytoplasmic cAMP FRET sensor, epac-CFP/YFP, in the absence (black curve) or presence (red curve) of β-arr1[IV-AA] (Left, n = 25), and with either siRNA targeting β-arr1/2 or scrambled siRNA (Right, n = 19). Cells were continuously perfused with control buffer or 100 nM M-PTH(1–14) (horizontal bar). Data represent the mean ± SEM. (B) Western blot analysis of β-arrestin expression in HEK293 cells, the osteoblastic-like ROS17/2.8 cell line, and primary calvarial osteoblasts (OB) from mice. (C) Averaged cAMP responses mediated by ISO (10 μM) or PTH(1–34) (100 nM) in osteosarcoma cells. Cyclic AMP induction over a 25-min time course was monitored by FRET changes from ROS17/2.8 osteoblastic-like cells transiently expressing the cAMP FRET-based biosensor epac-CFP/YFP alone (control) or with β-arrestin 1. Fsk, forskolin. (D) Bars represent the average cAMP responses of experiments shown in C determined by measuring the area under the curve from 0 to 25 min for cAMP. Data represent the mean ± SEM of n = 8 (ISO, ctrl), n = 8 (ISO, β-arr1), n = 14 (PTH, ctrl), and n = 8 (PTH, β-arr1) (**P < 0.01).

References

    1. Hein P, Frank M, Hoffmann C, Lohse MJ, Bünemann M. Dynamics of receptor/G protein coupling in living cells. EMBO J. 2005;24(23):4106–4114. - PMC - PubMed
    1. Ferrandon S, et al. Sustained cyclic AMP production by parathyroid hormone receptor endocytosis. Nat Chem Biol. 2009;5(10):734–742. - PMC - PubMed
    1. Calvert PD, et al. Membrane protein diffusion sets the speed of rod phototransduction. Nature. 2001;411(6833):90–94. - PubMed
    1. Lohse MJ, Benovic JL, Codina J, Caron MG, Lefkowitz RJ. Beta-arrestin: A protein that regulates beta-adrenergic receptor function. Science. 1990;248(4962):1547–1550. - PubMed
    1. Lohse MJ, et al. Receptor-specific desensitization with purified proteins. Kinase dependence and receptor specificity of beta-arrestin and arrestin in the beta 2-adrenergic receptor and rhodopsin systems. J Biol Chem. 1992;267(12):8558–8564. - PubMed

Publication types

MeSH terms

LinkOut - more resources