. 2013 Feb 22;288(8):5645-59.
doi: 10.1074/jbc.M112.410126. Epub 2013 Jan 7.

Phosphatidylinositol 4-phosphate 5-kinase α facilitates Toll-like receptor 4-mediated microglial inflammation through regulation of the Toll/interleukin-1 receptor domain-containing adaptor protein (TIRAP) location

Affiliations

Phosphatidylinositol 4-phosphate 5-kinase α facilitates Toll-like receptor 4-mediated microglial inflammation through regulation of the Toll/interleukin-1 receptor domain-containing adaptor protein (TIRAP) location

Tu Thi Ngoc Nguyen et al. J Biol Chem. .

Abstract

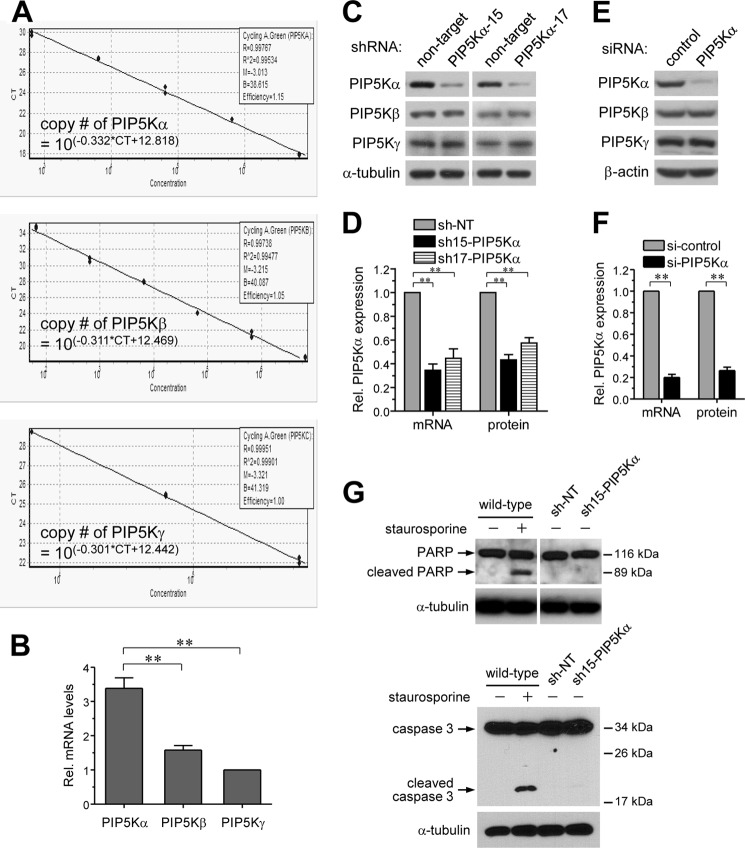
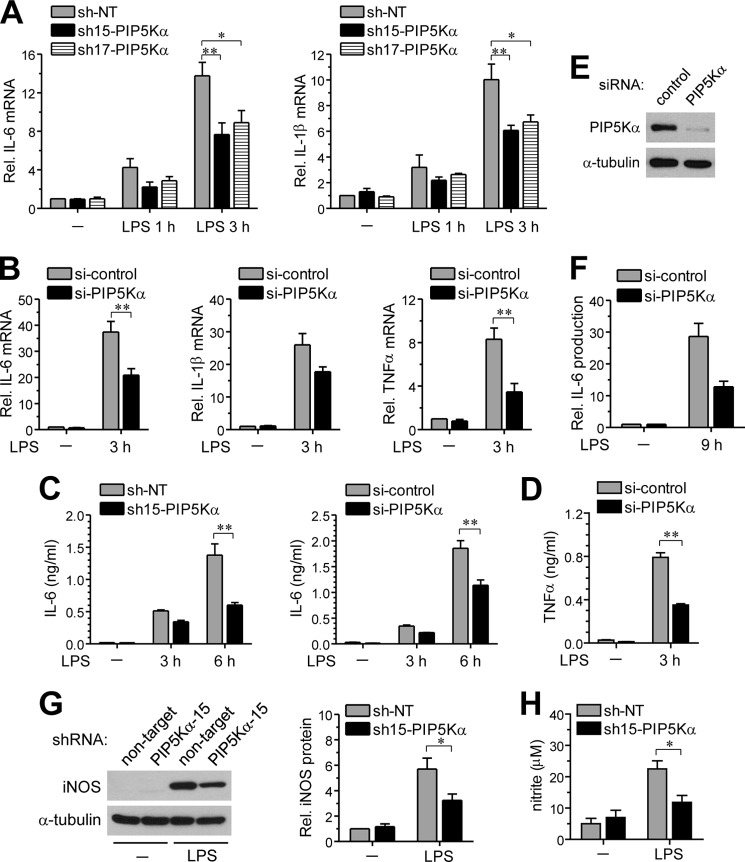
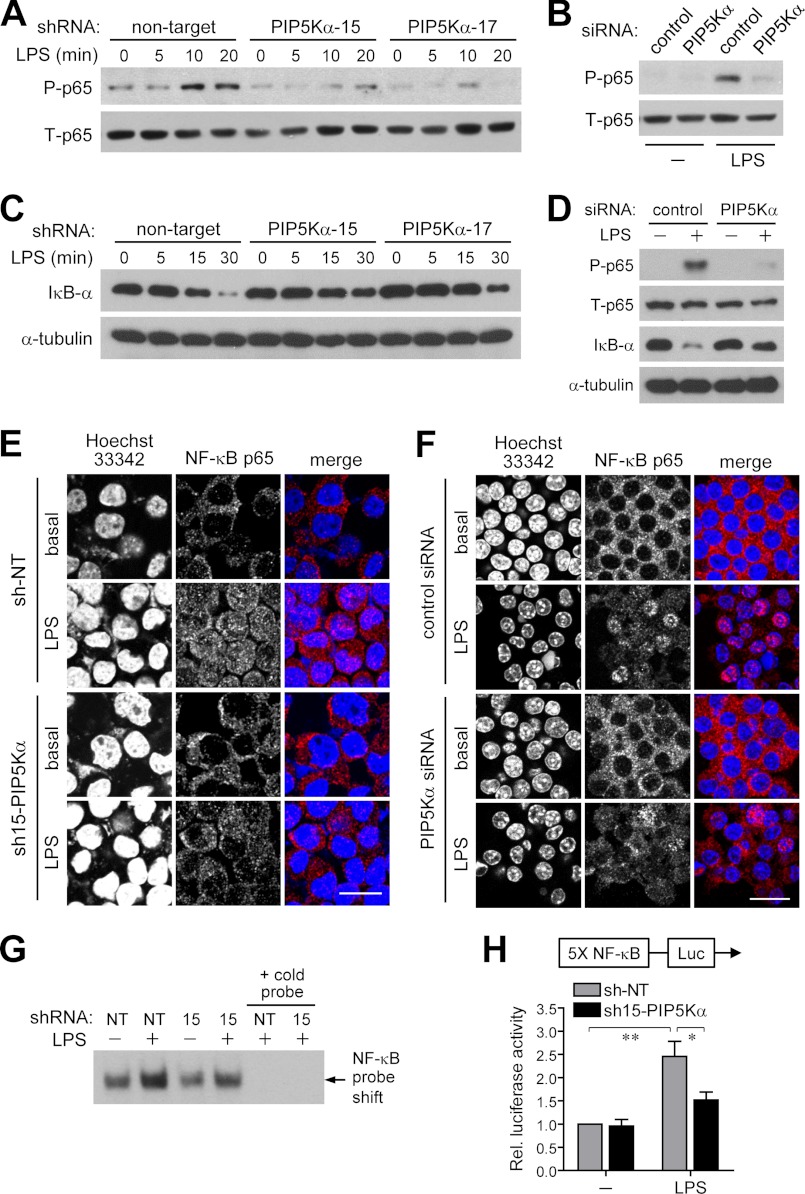
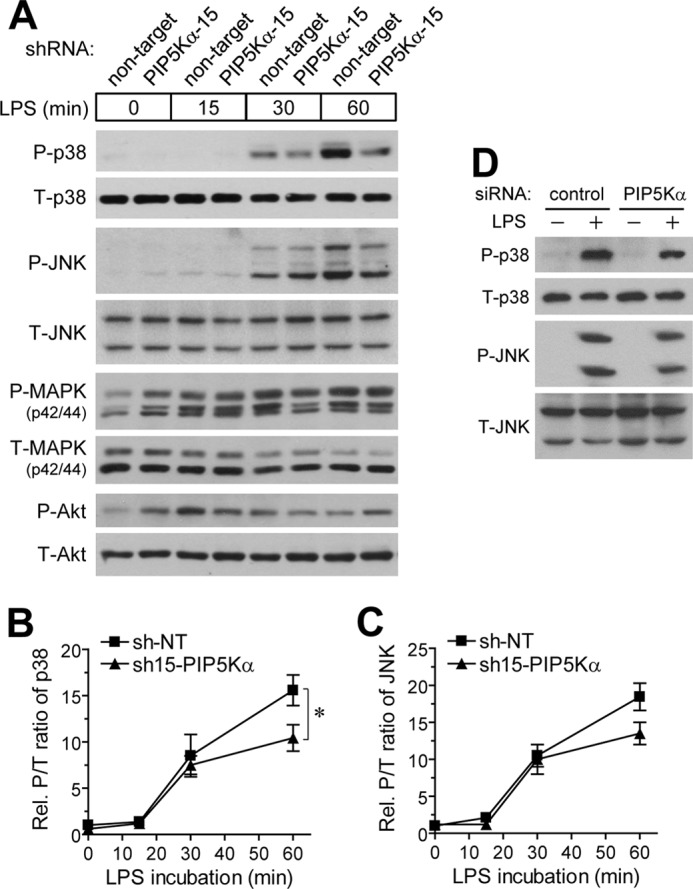
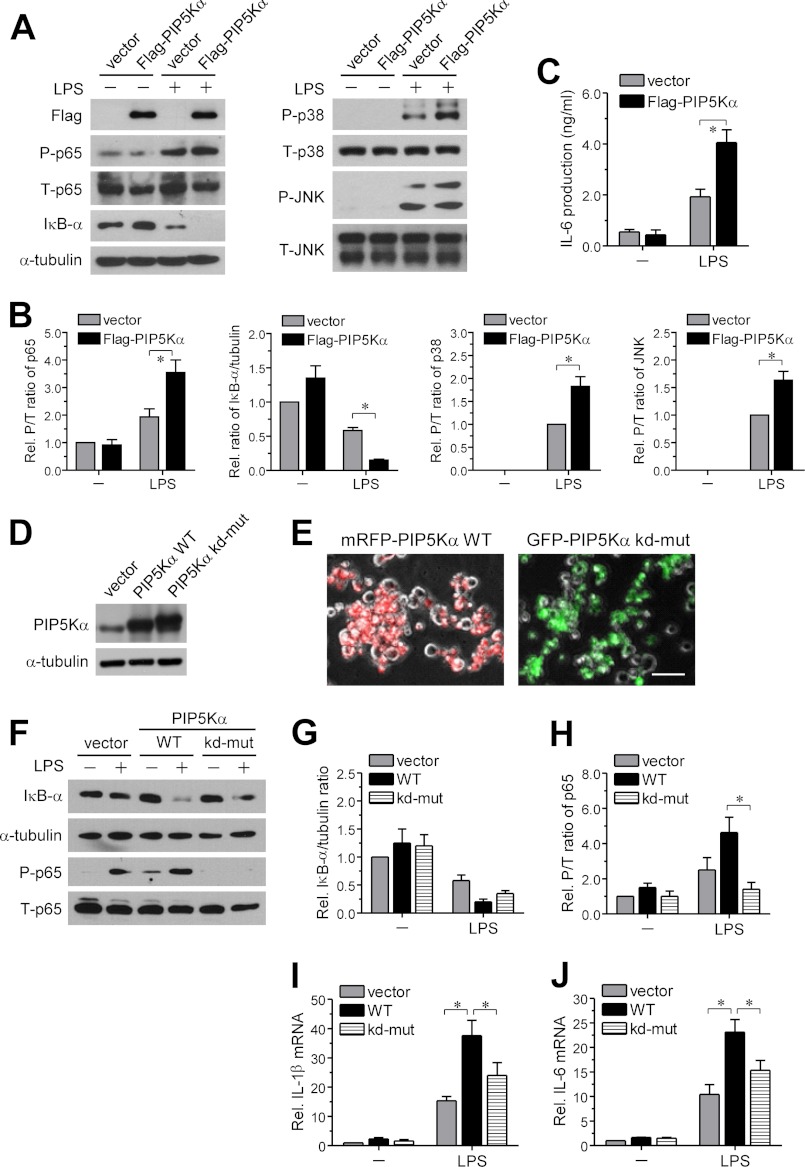
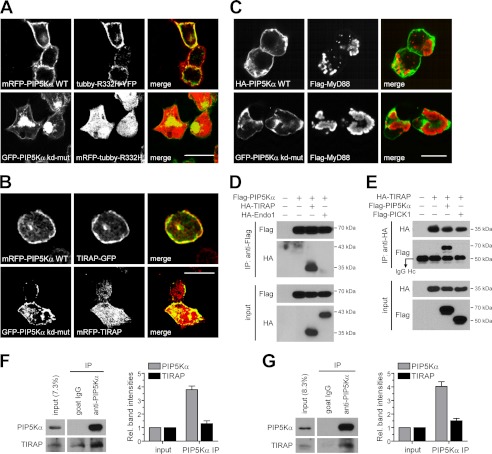
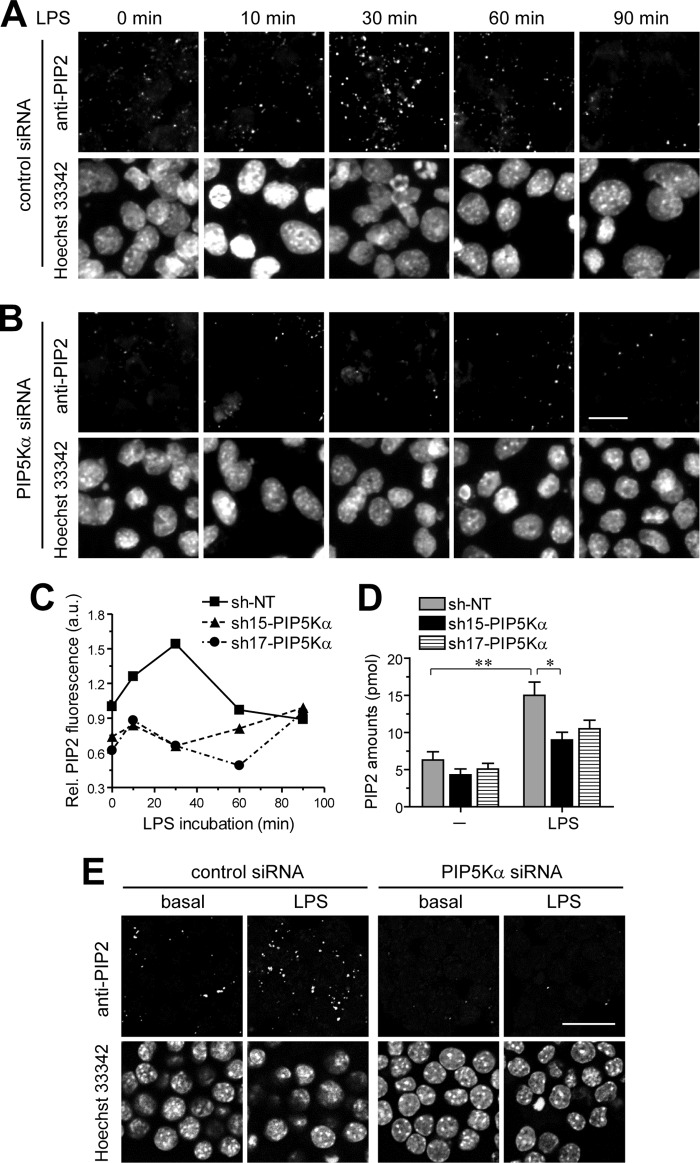
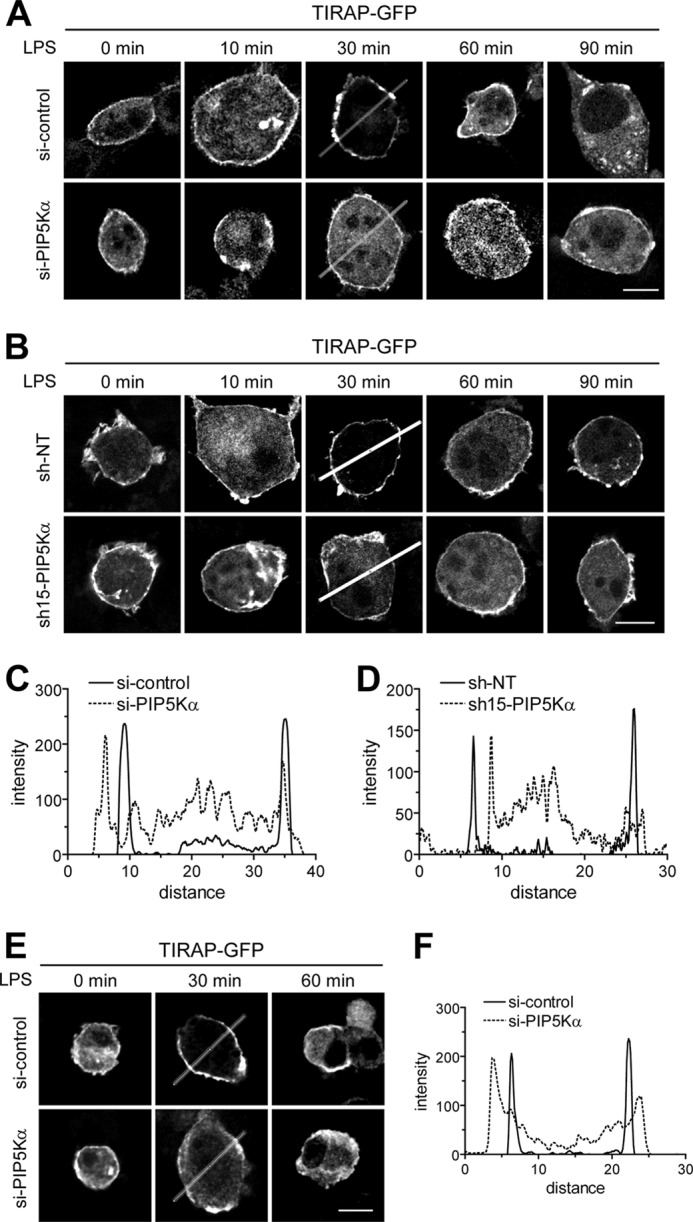
Phosphatidylinositol (PI) 4,5-bisphosphate (PIP(2)), generated by PI 4-phosphate 5-kinase (PIP5K), regulates many critical cellular events. PIP(2) is also known to mediate plasma membrane localization of the Toll/IL-1 receptor domain-containing adaptor protein (TIRAP), required for the MyD88-dependent Toll-like receptor (TLR) 4 signaling pathway. Microglia are the primary immune competent cells in brain tissue, and TLR4 is important for microglial activation. However, a functional role for PIP5K and PIP(2) in TLR4-dependent microglial activation remains unclear. Here, we knocked down PIP5Kα, a PIP5K isoform, in a BV2 microglial cell line using stable expression of lentiviral shRNA constructs or siRNA transfection. PIP5Kα knockdown significantly suppressed induction of inflammatory mediators, including IL-6, IL-1β, and nitric oxide, by lipopolysaccharide. PIP5Kα knockdown also attenuated signaling events downstream of TLR4 activation, including p38 MAPK and JNK phosphorylation, NF-κB p65 nuclear translocation, and IκB-α degradation. Complementation of the PIP5Kα knockdown cells with wild type but not kinase-dead PIP5Kα effectively restored the LPS-mediated inflammatory response. We found that PIP5Kα and TIRAP colocalized at the cell surface and interacted with each other, whereas kinase-dead PIP5Kα rendered TIRAP soluble. Furthermore, in LPS-stimulated control cells, plasma membrane PIP(2) increased and subsequently declined, and TIRAP underwent bi-directional translocation between the membrane and cytosol, which temporally correlated with the changes in PIP(2). In contrast, PIP5Kα knockdown that reduced PIP(2) levels disrupted TIRAP membrane targeting by LPS. Together, our results suggest that PIP5Kα promotes TLR4-associated microglial inflammation by mediating PIP(2)-dependent recruitment of TIRAP to the plasma membrane.


Figures

FIGURE 1.
FIGURE 1.
Establishment of stable PIP5Kα KD in BV2 microglia. A, qRT-PCR standard curves of the respective PIP5K isoforms were determined using Myc-tagged mouse PIP5Kα, PIP5Kβ, and PIP5Kγ plasmids as DNA templates. qRT-PCRs were performed for serially diluted plasmids containing different DNA copy numbers. Measured Ct values were plotted in a linear logarithmic scale, and the formulas were automatically calculated using Rotor-Gene 6000 software. B, cDNA samples from wild-type BV2 cells were analyzed by qRT-PCR using the same primer sets, and Ct values of PIP5Ks were measured. The DNA copy numbers of each PIP5K were determined from the standard curves and normalized to the copy number of PIP5Kγ. **, p < 0.01. C and D, BV2 microglial cells were stably expressed with NT shRNA or PIP5Kα-specific shRNA-15 or shRNA-17 using lentiviral infection. E and F, BV2 cells were transiently transfected with control siRNA or a mixture of PIP5Kα-specific siRNAs. C and E, protein levels of PIP5Kα, PIP5Kβ, and PIP5Kγ were analyzed by Western blotting with their specific antibodies. α-Tubulin or β-actin was used as a loading control. D and F, PIP5Kα mRNA levels in PIP5Kα KD cells were measured by qRT-PCR analyses and quantified relative to those in the corresponding control cells. Changes in PIP5Kα protein expression in C and E, respectively, were quantified in the same manner. G, wild-type BV2 cells untreated or treated with 1 μm staurosporine for 3 h and BV2 cells stably expressing NT shRNA or PIP5Kα shRNA-15 were assayed for cleavage of poly(ADP-ribose) polymerase (PARP) and caspase 3. Cell lysates prepared from the indicated conditions were subject to Western blot analysis of both proteins. Arrows indicate intact and cleaved forms of them. α-Tubulin was included as a loading control.
FIGURE 2.
FIGURE 2.
Effect of PIP5Kα KD on LPS-induced cytokine and nitric oxide production. PIP5Kα KD BV2 cells by shRNA-15 (A, C, G, and H), shRNA-17 (A) or siRNA (B--D), PIP5Kα KD RAW264.7 cells by siRNA (E and F), and their corresponding control KD cells were treated with or without LPS (100 ng/ml) for the indicated times. A and B, mRNA levels of IL-6, IL-1β, or TNFα were measured by qRT-PCR analyses and quantified as fold induction over the levels in unstimulated control KD cells. All transcriptional levels were normalized to GAPDH mRNA levels and determined by the 2−ΔΔCt method. Cell culture media were collected, and amounts of IL-6 (C and F) and TNFα (D) released into the culture media were measured by ELISA. E, PIP5Kα protein expression was analyzed by Western blotting with anti-PIP5Kα antibody. G, after overnight incubation, iNOS protein levels were measured by Western blotting. iNOS protein expression was quantified as fold changes over the levels in unstimulated NT shRNA. α-Tubulin (E and G) was included as a loading control. H, concentration of nitrite converted from nitric oxide released into the culture media was determined using the Griess reagent 24 h after LPS stimulation. Values in the bar graphs are presented as mean ± S.E. **, p < 0.01; *, p < 0.05.
FIGURE 3.
FIGURE 3.
Effect of PIP5Kα KD on LPS-induced activation and nuclear translocation of NF-κB. PIP5Kα KD BV2 cells by shRNA-15 (A, E, G, and H), shRNA-17 (A and C) or siRNA (B), PIP5Kα KD RAW264.7 cells by siRNA (D and F), and their corresponding control cells were treated with or without LPS (100 ng/ml) for the indicated times (A and C), 15 min (B) or 1 h (D--F). Protein levels of phosphorylated (P, Ser-536) and total (T) NF-κB p65 (A, B, and D) and IκB-α and α-tubulin (a loading control) (C and D) were measured by Western blot analyses. E and F, cells were immunostained with a primary antibody against NF-κB p65, followed by an Alexa Fluor 594-conjugated secondary antibody. The nuclei were visualized by Hoechst 33342 staining. Cell images were obtained using a confocal microscopy. Scale bars, 20 μm. G, nuclear extracts were prepared and processed for chemiluminescence-based NF-κB EMSA experiments. Nuclear extracts were incubated with a biotin-labeled NF-κB-specific oligonucleotide (10 ng) in the absence or presence of cold NF-κB-specific oligonucleotide (660 ng) and further probed with streptavidin-HRP. The arrow indicated shifted DNA probe for NF-κB. H, control (NT shRNA) and PIP5Kα shRNA-15 KD cells were cotransfected with a plasmid of 5×NF-κB-Luc reporter and a pRL-TK reporter and then treated with or without LPS (100 ng/ml) for 24 h. NF-κB activities were measured by luciferase assay, normalized to luciferase activities of pRL-TK, and quantified as fold changes over the control (unstimulated NT shRNA). Values in the bar graph are presented as mean ± S.E. **, p < 0.01; *, p < 0.05.
FIGURE 4.
FIGURE 4.
Effect of PIP5Kα KD on LPS-mediated phosphorylation of p38 and p42/44 MAPKs, JNK, and Akt. PIP5Kα shRNA-15 KD BV2 cells (A), PIP5Kα siRNA KD RAW264.7 cells (D), and their corresponding control cells were incubated in the presence and absence of LPS (100 ng/ml) for the indicated times (A) or 15 min (D). Cell lysates were analyzed for the phosphorylated (P) levels of p38 MAPK (Thr-180/Tyr-182), JNK (Thr-183/Tyr-185) (A and D), p42/44 MAPK (Thr-202/Tyr-204), and Akt (Ser-473) (A), and their total (T) levels by Western blotting with the respective specific antibodies. The P/T ratios of p38 MAPK (B) and JNK (C) in A were determined by measurements of band intensities of each protein kinase and quantified as fold changes over the control (NT shRNA at the zero time point). Values in the line graphs are presented as mean ± S.E. *, p < 0.05.
FIGURE 5.
FIGURE 5.
Effect of reconstituted wild-type or kinase-dead PIP5Kα expression in PIP5Kα KD cells on LPS-induced inflammatory responses. PIP5Kα shRNA-15 KD BV2 cells were transiently transfected with empty vector, FLAG-tagged wild-type (WT) PIP5Kα (A, C, D, F, I, and J), or a kinase-dead mutant (kd-mut) of PIP5Kα (D, F, I, and J) for 24 h and then treated with or without LPS (100 ng/ml) for 30 min (A and F), overnight (C), or 3 h (I and J). Overexpression of WT or kinase-dead mutant PIP5Kα was tested by Western blot analyses with anti-FLAG (A) or anti-PIP5Kα (D) antibody. A, protein levels of phosphorylated (P) and total (T) NF-κB p65, p38 MAPK, and JNK and of IκB-α and α-tubulin (a loading control) were measured by Western blot analyses. B, band intensities in the blots (A) were determined. The ratios of P/T NF-κB p65 and IκB-α/α-tubulin and the P/T ratios of p38 MAPK and JNK were quantified as fold changes over those in unstimulated vector condition and LPS-stimulated vector condition, respectively. C, concentration of IL-6 in the culture media was measured by ELISA. E, PIP5Kα shRNA-15 KD BV2 cells were transiently transfected with mRFP-PIP5Kα (wild-type) or GFP-PIP5Kα (kinase-dead) for 24 h. The fluorescent images were obtained using fluorescent microscopy for estimation of transection efficiency. Scale bar, 50 μm. IκB-α degradation (F and G) and NF-κB p65 phosphorylation (F and H) were assessed in the same manner as described in A and B. Transcriptional levels of IL-1β (I) and IL-6 (J) were measured by qRT-PCR analysis and quantified as fold induction over the levels in unstimulated vector condition. Values in the bar graphs are presented as mean ± S.E. *, p < 0.05.
FIGURE 6.
FIGURE 6.
Effect of PIP5Kα activity on plasma membrane targeting of TIRAP and their colocalization and interaction. HEK293T cells were transfected for 24 h with mRFP-tagged wild-type (WT) PIP5Kα or GFP-tagged kinase-dead mutant (kd-mut) of PIP5Kα (A and B) together with YFP- or mRFP-tagged tubby R332H (A) or with GFP- or mRFP-tagged TIRAP (B), as indicated in the cell images. After fixation, fluorescent fusion proteins were visualized under the corresponding channels. C, HA-PIP5Kα WT or GFP-PIP5Kα kinase-dead mutant was coexpressed with FLAG-MyD88 in HEK293T cells for 24 h. Cells were immunostained with HA and/or FLAG antibodies, followed by Alexa Fluor 488- and 594-labeled secondary antibodies, respectively. A–C, the fluorescent images were obtained using confocal microscopy. Scale bars, 20 μm. D and E, HEK293T cells were transfected for 24 h with FLAG-PIP5Kα and/or HA-TIRAP as indicated. Cell lysates were immunoprecipitated (IP) using anti-FLAG antibody-conjugated beads (D) or using anti-HA antibody and protein G-agarose beads (E). As a negative control, HA-tagged endophilin 1 (Endo1) (D) and FLAG-tagged PICK1 (E) were cotransfected with FLAG-PIP5Kα and HA-TIRAP, respectively. Then the immunoprecipitates (IP) and starting lysates (input) were analyzed by Western blotting with anti-FLAG and anti-HA antibodies. The arrow in E indicated IgG heavy chain. Precleared wild-type BV2 (F) and HeLa (G) cell lysates were subject to immunoprecipitation with anti-PIP5Kα antibody or normal goat IgG. The resulting immunoprecipitation and input samples were analyzed by Western blotting using antibodies against PIP5Kα, mouse TIRAP (F, Abcam), and human TIRAP (G, Abnova). Bar graphs in F and G represented relative band intensities of PIP5Kα and TIRAP in the PIP5Kα IP samples normalized to those in input samples. TIRAP band intensities in the control IgG IP were subtracted from those in the PIP5Kα IP.
FIGURE 7.
FIGURE 7.
Time-dependent effect of LPS on PIP2 concentration between control and PIP5Kα KD cells. PIP5Kα KD BV2 cells (A and B) and RAW264.7 cells (E) by control or PIP5Kα siRNA were treated with LPS (100 ng/ml) for the indicated times (A and B) or 30 min (E), then fixed, and permeabilized. PIP2 was visualized by immunocytochemical staining of cells with PIP2-specific primary antibody, biotinylated secondary antibody, and then Alexa Fluor 594-conjugated streptavidin. PIP2 fluorescent images (z-stacks) were obtained using confocal microscopy. Cells were outlined by nuclear Hoechst 33342 staining. Scale bars, 20 μm. Control (NT shRNA), PIP5Kα shRNA-15, or shRNA-17 KD BV2 cells were treated with LPS (100 ng/ml) for the indicated times (C) or 30 min (D). C, cells were processed for PIP2 immunofluorescence in the same manner as described in A and B. PIP2 fluorescent intensities from more than 50 individual cells were quantified using ImageJ software (National Institutes of Health) at each time point. Values in the line graph represent mean fluorescent intensity normalized to the mean intensity in NT shRNA at the zero time point. D, cellular PIP2 levels from extracted acidic lipids were measured using the PIP2 mass ELISA kit and determined from the PIP2 standard curve. Values in the bar graph are presented as mean ± S.E. **, p < 0.01; *, p < 0.05.
FIGURE 8.
FIGURE 8.
Effect of PIP5Kα KD on LPS-induced recruitment of TIRAP to the plasma membrane. PIP5Kα KD BV2 cells by siRNA (A) or shRNA-15 (B), PIP5Kα KD RAW264.7 cells by siRNA (E), and their corresponding control KD cells were transiently transfected with TIRAP-GFP for 24 h. After treatment with LPS (100 ng/ml) for the indicated times, cells were fixed, and then fluorescent images of TIRAP-GFP fusion protein were captured using confocal microscopy. Scale bars, 10 μm. C, D, and F, GFP fluorescent intensities were quantified from the images obtained 30 min after LPS stimulation in A, B, and E, respectively, with the Zeiss ZEN imaging software. The graphs represent the intensity profiles along the lines, indicating a differential cytoplasm/plasma membrane distribution of TIRAP between the control and PIP5Kα KD cells.

References

    1. Aloisi F. (2001) Immune function of microglia. Glia 36, 165–179 - PubMed
    1. Hanisch U. K., Kettenmann H. (2007) Microglia. Active sensor and versatile effector cells in the normal and pathologic brain. Nat. Neurosci. 10, 1387–1394 - PubMed
    1. Kim S. U., de Vellis J. (2005) Microglia in health and disease. J. Neurosci. Res. 81, 302–313 - PubMed
    1. Block M. L., Zecca L., Hong J. S. (2007) Microglia-mediated neurotoxicity. Uncovering the molecular mechanisms. Nat. Rev. Neurosci. 8, 57–69 - PubMed
    1. Yang M. S., Min K. J., Joe E. (2007) Multiple mechanisms that prevent excessive brain inflammation. J. Neurosci. Res. 85, 2298–2305 - PubMed

Publication types