. 2013 Feb 22;288(8):5992-6003.
doi: 10.1074/jbc.M112.416347. Epub 2013 Jan 6.

Molecular architecture of a complex between an adhesion protein from the malaria parasite and intracellular adhesion molecule 1

Affiliations

Molecular architecture of a complex between an adhesion protein from the malaria parasite and intracellular adhesion molecule 1

Alan Brown et al. J Biol Chem. .

Abstract

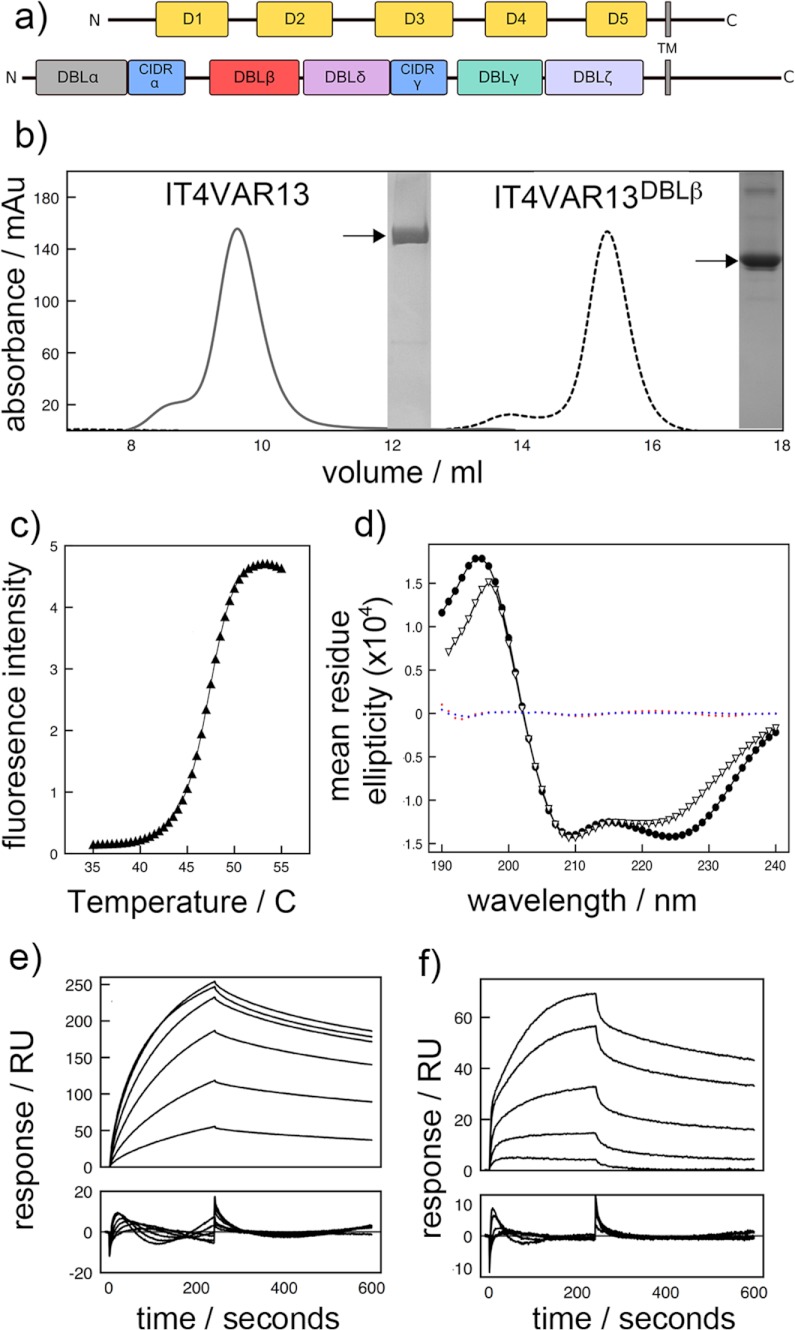
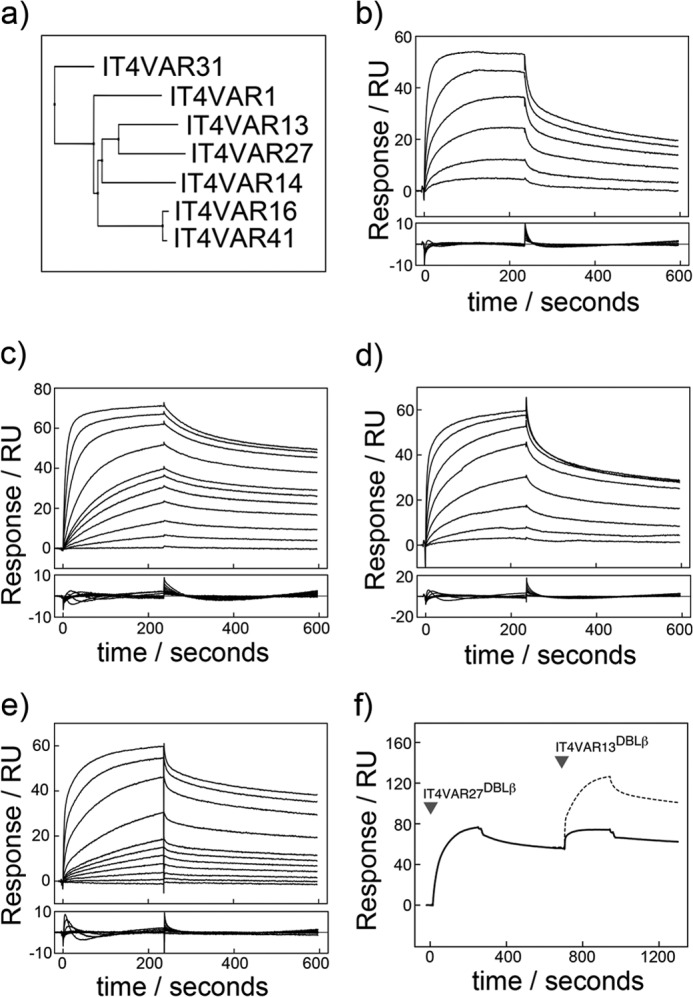
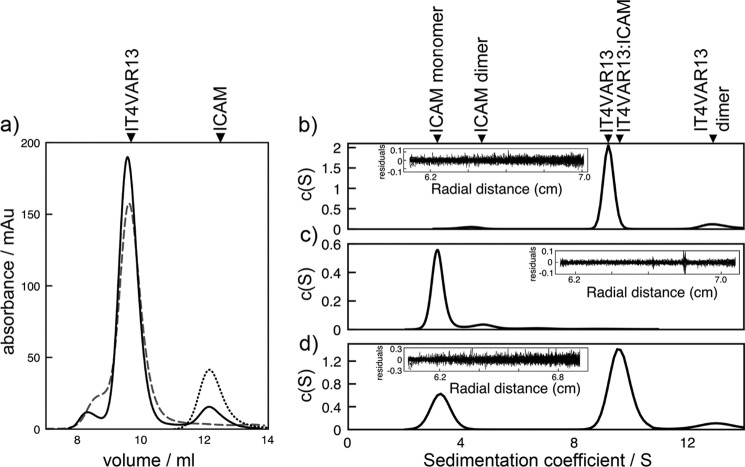
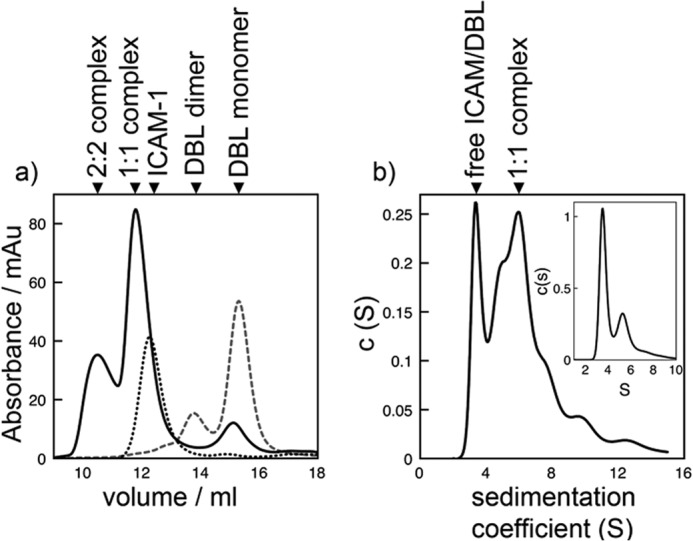
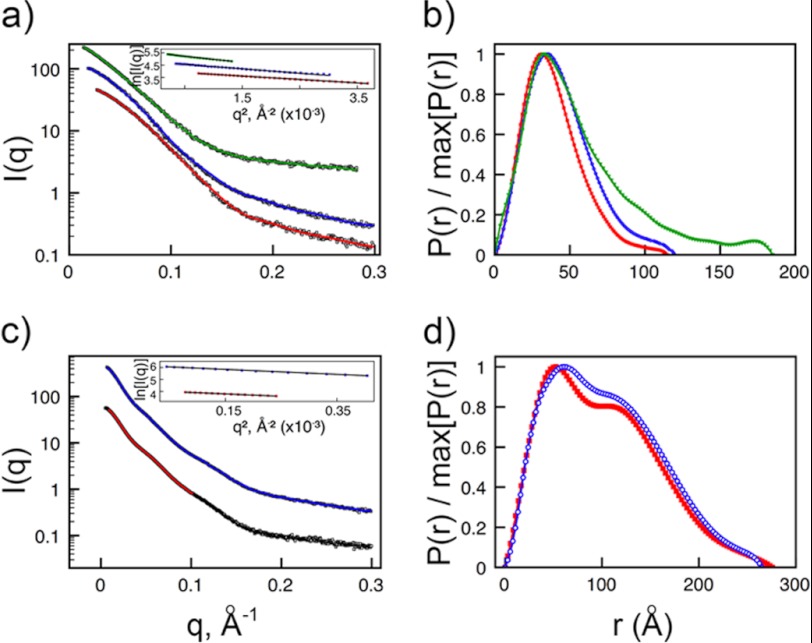
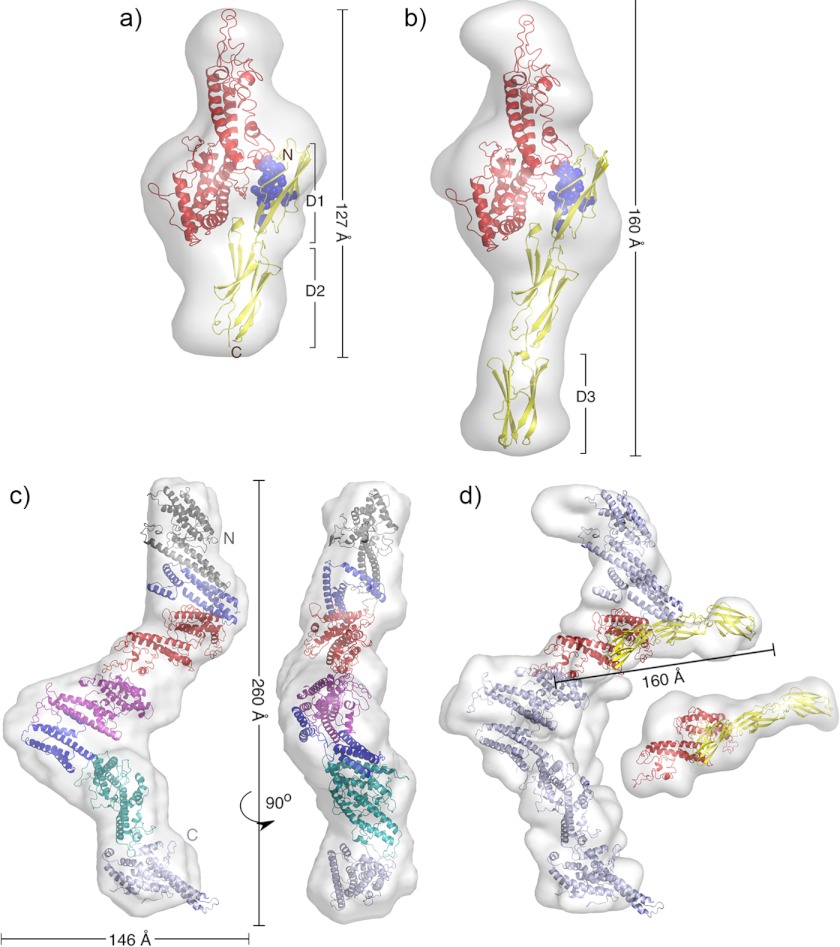
The adhesion of Plasmodium falciparum-infected erythrocytes to human tissues or endothelium is central to the pathology caused by the parasite during malaria. It contributes to the avoidance of parasite clearance by the spleen and to the specific pathologies of cerebral and placental malaria. The PfEMP1 family of adhesive proteins is responsible for this sequestration by mediating interactions with diverse human ligands. In addition, as the primary targets of acquired, protective immunity, the PfEMP1s are potential vaccine candidates. PfEMP1s contain large extracellular ectodomains made from CIDR (cysteine-rich interdomain regions) and DBL (Duffy-binding-like) domains and show extensive variation in sequence, size, and domain organization. Here we use biophysical methods to characterize the entire ∼300-kDa ectodomain from IT4VAR13, a protein that interacts with the host receptor, intercellular adhesion molecule-1 (ICAM-1). We show through small angle x-ray scattering that IT4VAR13 is rigid, elongated, and monomeric. We also show that it interacts with ICAM-1 through the DBLβ domain alone, forming a 1:1 complex. These studies provide a first low resolution structural view of a PfEMP1 ectodomain in complex with its ligand. They show that it combines a modular domain arrangement consisting of individual ligand binding domains, with a defined higher order architecture that exposes the ICAM-1 binding surface to allow adhesion.


Figures

FIGURE 1.
FIGURE 1.
The DBLβ domain of IT4VAR13 binds ICAM-1D1D2 with nanomolar affinity. a, shown is a schematic of IT4VAR13 and ICAM-1. IT4VAR13 contains seven domains: five DBL domains (DBLα (gray), -β (red), -δ (magenta), -γ (teal), and -ζ (light blue)) and two CIDR domains (CIDRα and -γ (both blue)). ICAM-1 has five immunoglobulin-like domains (D1–D5 (yellow)). Both proteins have a single transmembrane (TM) domain. IT4VAR13 domain boundaries were set according to Rask et al. (16), and ICAM-1 domain boundaries were according to PFAM. b, shown is a size-exclusion chromatogram of IT4VAR13 and IT4VAR13DBLβ with purity shown by SDS-PAGE. IT4VAR13 is predominantly monomeric but with a shoulder indicating the presence of higher order aggregates that elute near the void volume. IT4VAR13DBLβ is similarly predominantly monomeric, with a low percentage of dimer. mAu, milliabsorbance units. c, shown is a representative fluorescence melting curve for IT4VAR13DBLβ in 20 mm Tris, pH 8.0, 150 mm NaCl. The temperature was altered in 0.5 °C increments. The y axis shows fluorescence (arbitrary units). IT4VAR13DBLβ has a melting temperature (Tm) of 47.5 °C. d, secondary structure analysis by CD is shown. Spectra were recorded between 190 and 240 nm for IT4VAR13 (●) and IT4VAR13DBLβ (▿). For each protein, three measurements were averaged, normalized for buffer absorption, and deconvoluted using an experimental model. Fitting residuals for IT4VAR13 (blue) and IT4VAR13DBLβ (red) are shown. IT4VAR13 is composed of 46% α-helix and 18% β-strand, and IT4VAR13DBLβ is composed of 57% α-helix and 6% β-strand. Shown are SPR sensorgrams (upper panels) with fitting residuals (lower panels) for the binding of IT4VAR13 to ICAM-1D1D5-Fc at concentrations of 5, 10, 20, 30, 40, and 50 nm (e) and IT4VAR13DBLβ to ICAM-1D1D5-Fc (10, 20, 30, 40, and 50 nm) (f). Binding was conducted with a 4-min association phase and 6-min dissociation phase at a constant flow rate of 30 ml min−1. In each case the lower panel shows residuals from binding.
FIGURE 2.
FIGURE 2.
Characterization by SPR of the interactions of ICAM-1 with multiple DBLβ domains from the P. falciparum IT4 isolate. a, shown is a phylogenetic tree of seven PfEMP1 DBLβ domains known to bind ICAM-1 from the P. falciparum IT4 isolate. Shown are sensorgrams (upper panel) with resulting residuals when fit to a one-site kinetic model (lower panel). Shown are SPR sensorgrams (upper panels) with fitting residuals (lower panels) for the binding of IT4VAR16DBLβ (50, 100, 250, 500, 1000, and 2000 nm) (b), IT4VAR27DBLβ (1, 5, 10, 20, 30, 40, 50, 100, 250, 500, and 1000 nm) (c), IT4VAR31DBLβ (0.05, 0.1, 0.25, 1, 2, 5, and 10 μm) (d), and IT4VAR41DBLβ (1, 5, 10, 20, 30, 40, 50, 100, 250, 500, and 1000 nm) (e) to ICAM-1D1D2-Fc with an association phase of 4 min and a dissociation phase of 6 min at a flow rate of 30 μl min−1. f, DBLβ domains from IT4VAR13 and IT4VAR27 recognize ICAM-1 with overlapping binding sites. Expected binding levels assuming IT4VAR13DBLβ bound to ICAM-1 in a mode independent and unaffected by the binding of IT4VAR27DBLβ are shown with a dashed line. Actual binding levels shown by a solid line.
FIGURE 3.
FIGURE 3.
Stoichiometry of the interaction between IT4VAR13 and ICAM-1. Stoichiometry was determined by analytical SEC (a) and ultracentrifugation (b-d). mAu, milliabsorbance units. a, shown is a size-exclusion chromatogram of IT4VAR13 (gray, wide dashes), ICAM-1D1D5 (black, short dashes), and IT4VAR13·ICAM-1D1D5 (black, continuous line) from a calibrated Superdex S200 column. Shown are continuous sedimentation coefficient distributions that best describe the AUC data, with fitting residuals inset for IT4VAR13 (b) ICAM-1D1D5 (c), and IT4VAR13 (d) incubated with ICAM-1D1D5 for 30 min before centrifugation.
FIGURE 4.
FIGURE 4.
Stoichiometry of the interaction between IT4VAR13DBLβ and ICAM-1. Stoichiometry was determined by analytical SEC (a) and ultracentrifugation (b). mAu, milliabsorbance units. a, shown is a size-exclusion chromatogram of IT4VAR13DBLβ (gray, wide dashes), ICAM-1D1D5 (black, short dashes) and IT4VAR13DBLβ·ICAM-1D1D5 (black, continuous line). b, shown is continuous sedimentation coefficient distribution that best describes the AUC data for IT4VAR13DBLβ incubated with ICAM-1D1D5 for 30 min before centrifugation with the continuous sedimentation coefficient distribution for IT4VAR13DBLβ inset for comparison. The distribution for ICAM-1D1D5 is in Fig. 3c.
FIGURE 5.
FIGURE 5.
SAXS analysis of IT4VAR13·ICAM-1 complexes. a, shown is theoretical scattering calculated from ab initio reconstructions (continuous lines with IT4VAR13DBLβ in red, IT4VAR13DBLβ·ICAM-1D1D2 in blue, and IT4VAR13DBLβ-ICAM-1D1D5 in green) superimposed onto experimental scattering intensity curves (squares). Guinier plots are inset. b, shown are distance distribution function, P(r), plots for IT4VAR13DBLβ (squares, red); IT4VAR13DBLβ·ICAM-1D1D2 (circles, blue), and IT4VAR13DBLβ·ICAM-1D1D5 (triangles, green). c, theoretical scattering is calculated from ab initio reconstructions for full-length IT4VAR13 ectodomain (continuous lines with IT4VAR13 in red and IT4VAR13-ICAM-1D1D5 in blue) superimposed onto the experimental scattering intensity curves (squares). d, shown are P(r) plots for IT4VAR13 (squares, red) and IT4VAR13·ICAM-1D1D5 (circles, blue). The P(r) functions were calculated from the scattering intensity I(q) and normalized to unity at their maxima.
FIGURE 6.
FIGURE 6.
SAXS-derived architectures of IT4VAR13-ICAM-1 complexes. Models of the IT4VAR13DBLβ·ICAM-1D1D2 (a) and IT4VAR13DBLβ·ICAM-1D1D5 (b) complexes are based on ab initio SAXS envelopes. IT4VAR13DBLβ (red) was homology-modeled using EBA-175 (PDB ID 1ZRL) and DBL3x (PDB ID 3BQK) as templates. ICAM-1 domains 1 (D1) and 2 (D2) were extracted from PDB ID 1IAM, and domain 3 was from PDB ID 1P53 (all yellow). ICAM-1 residues identified as reducing infected erythrocyte adhesion under flow conditions are shown as blue spheres. c, a low resolution structure of IT4VAR13 was determined from SAXS data showing front and side views. All domains were modeled using homology to known structures. d, a low resolution structure of the IT4VAR13·ICAM-1D1D5 complex was determined from SAXS data. ICAM-1D1D5 exclusively contacts IT4VAR13DBLβ.

References

    1. WHO (2011) World Malaria Report 2011, Geneva, Switzerland
    1. Turner G. D., Morrison H., Jones M., Davis T. M., Looareesuwan S., Buley I. D., Gatter K. C., Newbold C. I., Pukritayakamee S., Nagachinta B. (1994) An immunohistochemical study of the pathology of fatal malaria. Evidence for widespread endothelial activation and a potential role for intercellular adhesion molecule-1 in cerebral sequestration. Am. J. Pathol. 145, 1057–1069 - PMC - PubMed
    1. Pongponratn E., Turner G. D., Day N. P., Phu N. H., Simpson J. A., Stepniewska K., Mai N. T., Viriyavejakul P., Looareesuwan S., Hien T. T., Ferguson D. J., White N. J. (2003) An ultrastructural study of the brain in fatal Plasmodium falciparum malaria. Am. J. Trop. Med. Hyg. 69, 345–359 - PubMed
    1. Smith J. D., Chitnis C. E., Craig A. G., Roberts D. J., Hudson-Taylor D. E., Peterson D. S., Pinches R., Newbold C. I., Miller L. H. (1995) Switches in expression of Plasmodium falciparum var genes correlate with changes in antigenic and cytoadherent phenotypes of infected erythrocytes. Cell 82, 101–110 - PMC - PubMed
    1. Su X. Z., Heatwole V. M., Wertheimer S. P., Guinet F., Herrfeldt J. A., Peterson D. S., Ravetch J. A., Wellems T. E. (1995) The large diverse gene family var encodes proteins involved in cytoadherence and antigenic variation of Plasmodium falciparum-infected erythrocytes. Cell 82, 89–100 - PubMed

Publication types

MeSH terms