Review
. 2013:9:621-48.
doi: 10.1146/annurev-clinpsy-050212-185535. Epub 2013 Jan 7.

Neuroimaging and other biomarkers for Alzheimer's disease: the changing landscape of early detection

Affiliations
Review

Neuroimaging and other biomarkers for Alzheimer's disease: the changing landscape of early detection

Shannon L Risacher et al. Annu Rev Clin Psychol. 2013.

Abstract

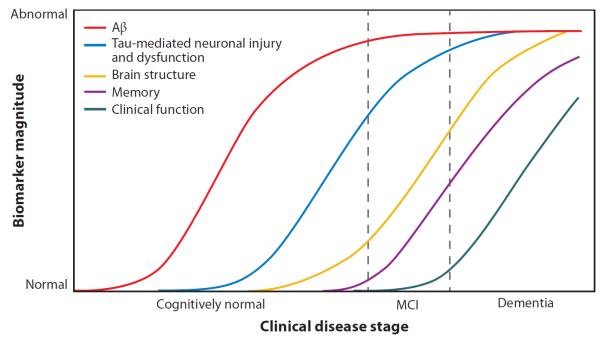
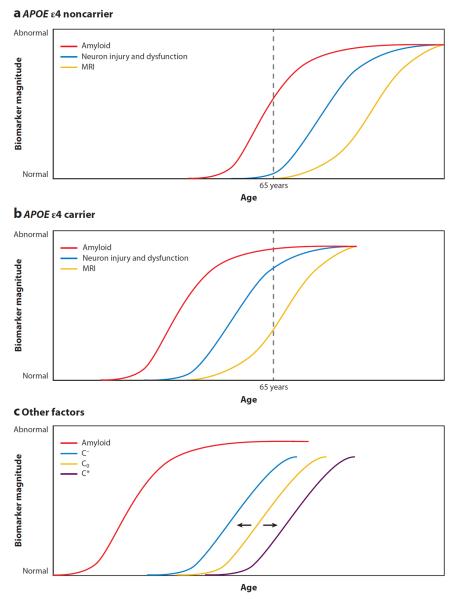
The goal of this review is to provide an overview of biomarkers for Alzheimer's disease (AD), with emphasis on neuroimaging and cerebrospinal fluid (CSF) biomarkers. We first review biomarker changes in patients with late-onset AD, including findings from studies using structural and functional magnetic resonance imaging (MRI), advanced MRI techniques (diffusion tensor imaging, magnetic resonance spectroscopy, perfusion), positron emission tomography with fluorodeoxyglucose, amyloid tracers, and other neurochemical tracers, and CSF protein levels. Next, we evaluate findings from these biomarkers in preclinical and prodromal stages of AD including mild cognitive impairment (MCI) and pre-MCI conditions conferring elevated risk. We then discuss related findings in patients with dominantly inherited AD. We conclude with a discussion of the current theoretical framework for the role of biomarkers in AD and emergent directions for AD biomarker research.


Figures

Figure 1
Figure 1
Hypothetical timeline for the progression of neuropathology and clinical symptoms associated with Alzheimer's disease (AD). This figure shows a theoretical timeline for the progression of AD-related neuropathology and clinical changes, with changes in amyloid and tau pathology occurring years before the onset of AD. The gray-, blue-, and red-shaded bars reflect time points at which different types of potential interventions may be beneficial (gray, preventative; blue, disease modifying; red, symptomatic). Reprinted by permission from Macmillan Publishers Ltd: Nature Reviews Drug Discovery, [Shaw LM et al., Biomarkers of neurodegeneration for diagnosis and monitoring therapeutics. Nat. Rev. Drug Discov. 6:295–303], copyright 2007. MCI, mild cognitive impairment.
Figure 2
Figure 2
Differences in brain atrophy, glucose metabolism, and amyloid deposition between patients with Alzheimer's disease (AD) and mild cognitive impairment (MCI) and healthy older adults controls (HCs). The pattern of differences between AD, MCI, and HC is demonstrated in (a) brain atrophy [measured using structural magnetic resonance imaging (MRI)], (b) glucose metabolism [measured using [18F]fluorodeoxyglucose positron emission tomography (FDG PET)], and (c) amyloid accumulation [measured using [11C]Pittsburgh compound B positron emission tomography (PiB PET)]. Relative to HC, patients with AD show significantly reduced brain gray matter (GM) density throughout cortical and subcortical regions (a; AD versus HC), reduced glucose metabolism in regions of the medial and lateral parietal lobe, medial and lateral temporal lobes, and medial and lateral frontal lobes (b; AD versus HC), as well as increased amyloid accumulation throughout the cerebral cortex (c; AD versus HC). MCI patients also show similar, although more focal, changes relative to HC, including reduced GM density in the medial and lateral temporal lobes (a; MCI versus HC), reduced glucose metabolism in the medial and lateral temporal lobes, medial and lateral parietal lobes, and frontal lobe (b; MCI versus HC), and greater amyloid deposition in the frontal, parietal, and temporal cortices (c; MCI versus HC). The comparisons of these measures between patients with AD to patients with MCI show interesting patterns of association with disease severity. Specifically, patients with AD show significantly more GM atrophy in regions of the medial and lateral temporal lobes and parietal lobes (a; AD versus MCI) and reduced glucose metabolism in the medial and lateral temporal lobes, medial and lateral parietal lobes, and frontal lobe (b; AD versus MCI) relative to MCI patients. However, only minor differences in amyloid accumulation between AD and MCI patients are observed (c; AD versus MCI), suggesting the majority of amyloid accumulation occurs before a participant has reached a clinical diagnosis of MCI, as has been previously reported (Jack et al. 2009, 2010b). This figure was generated using data from the Alzheimer's Disease Neuroimaging Initiative cohort and utilizing traditional methods that have been previously described (Jagust et al. 2010, Risacher et al. 2009, Swaminathan et al. 2011). Panel a is displayed at a voxel-wise threshold of p <0.01 (family-wise error correction for multiple comparisons) and minimum cluster size (k) = 50 voxels and includes 189 AD, 396 MCI, and 225 HC participants; panel b is displayed at a voxel-wise threshold of p <0.001 (uncorrected for multiple comparisons) and k = 50 voxels and includes 97 AD, 203 MCI, and 102 HC participants; panel c is displayed at a voxel-wise threshold of p <0.01 (uncorrected for multiple comparisons) and k = 50 voxels and includes 25 AD, 56 MCI, and 22 HC participants.
Figure 3
Figure 3
Functional MRI activation and deactivation patterns in Alzheimer's disease (AD), mild cognitive impairment (MCI), and healthy control (HC) participants. This figure demonstrates (a) patterns of activation in the medial temporal lobe and patterns of (b) deactivation in the default mode network (DMN) during a memory task in patients with AD and MCI, as well as HCs. (a) During a face-name encoding task, patients with AD showed significantly reduced hippocampal activation relative to HCs and patients with MCI. However, patients with MCI showed increased hippocampal activation relative to HCs. (b) Upon initiation of an episodic encoding task, MCI and AD patients demonstrated altered deactivation of the DMN, which includes the medial and lateral parietal lobes, medial and lateral temporal lobes, and prefrontal cortex. However, these changes were different by disease severity. Specifically, less impaired MCI patients [low CDR-Sum of Boxes score (low SB)] demonstrated increased connectivity in the DMN relative to HC, whereas more impaired MCI (high-SB) and AD patients showed decreased DMN connectivity relative to HCs. Panel a is adapted with permission from Dickerson BC et al. 2005. Increased hippocampal activation in mild cognitive impairment compared to normal aging and AD. Neurology 65:404–11. Panel b is adapted with permission from Celone KA et al. 2006. Alterations in memory networks in mild cognitive impairment and Alzheimer's disease: an independent component analysis. J. Neurosci. 26:10222–31.
Figure 4
Figure 4
Comparison of neuroimaging, cerebrospinal fluid (CSF), and cognitive measures relative to the estimated age of symptom onset in patients with familial Alzheimer's disease (AD). The relative difference between carriers of autosomal dominant AD mutations [mutation carriers (MCs)] and noncarriers (NCs) in neuroimaging, CSF, and cognitive measures at multiple time points prior to and after the estimated age of symptom onset is shown. Measures of amyloid-beta (Aβ) appear to change earliest in MCs relative to NCs, followed by measures of CSF tau, hippocampal atrophy, and glucose hypometabolism. All of the neuroimaging and CSF biomarkers show alterations in MCs relative to NCs before the estimated age of symptom onset. Reproduced from The New England Journal of Medicine, Bateman RJ et al., Clinical and biomarker changes in dominantly inherited Alzheimer's disease, 367, 795–804, © 2012 Massachusetts Medical Society. Reprinted with permission from Massachusetts Medical Society. CDR-SOB, Clinical Dementia Rating Scale, Sum of Boxes score.
Figure 5
Figure 5
Hypothetical model of biomarker change across the cascade of Alzheimer's disease (AD) pathologic progression and clinical decline. This figure represents a theoretical framework for the ordering and dynamic sensitivity of various AD biomarkers across the pathologic and clinical AD spectrum. Specifically, this model suggests that the earliest neuropathological changes occur with the accumulation of amyloid-beta (Aβ), followed by neuronal injury and dysfunction, then neurodegeneration, and finally cognitive and clinical decline. These various stages can be monitored using known AD biomarkers, including monitoring of Aβ accumulation with cerebrospinal fluid (CSF) and positron emission tomography (PET) measures, neuronal injury and dysfunction with CSF tau measures, [18F]fluorodeoxyglucose PET, and potentially functional magnetic resonance imaging (MRI) measures, neurodegeneration with structural MRI, and cognition and clinical decline with psychometric and clinical testing. Reprinted from The Lancet Neurology, Volume 9(1), Jack CR Jr et al., Hypothetical model of dynamic biomarkers of the Alzheimer's pathological cascade, 119–28, copyright 2010, with permission from Elsevier. MCI, mild cognitive impairment.
Figure 6
Figure 6
Modulation of biomarker curves by genetics [apolipoprotein E (APOE) genotype] and cognitive reserve. Factors such as genetic variations and cognitive reserve may shift the hypothetical biomarker curves relative to age and disease stage. Genetic variation in the APOE gene may shift the amyloid-beta (Aβ) and neurodegeneration curves, with (a) individuals positive for APOE ε4 showing a leftward shift (pathology occurring at an earlier age) and/or (b) individuals negative for APOE ε4 showing a rightward shift (pathology occurring at a later age). (c) Other cognitive and/or health and lifestyle factors may also shift these hypothetical curves, particularly the curve representing changes in cognition. Those with low cognitive reserve and/or with a high number of medical comorbidities (C) may show a leftward shift of the cognition curve, whereas those with high cognitive reserve and/or few medical comorbidities (C*) may show a rightward shift, relative to the initially hypothesized cognition curve (Co). Reprinted from The Lancet Neurology, Volume 9(1), Jack CR Jr et al., Hypothetical model of dynamic biomarkers of the Alzheimer's pathological cascade, 119–28, copyright 2010, with permission from Elsevier. MRI, magnetic resonance imaging.

References

    1. Abdulrab K, Heun R. Subjective memory impairment. A review of its definitions indicates the need for a comprehensive set of standardised and validated criteria. Eur. Psychiatry. 2008;23:321–30. - PubMed
    1. Aisen PS, Petersen RC, Donohue MC, Gamst A, Raman R, et al. Clinical core of the Alzheimer's Disease Neuroimaging Initiative: progress and plans. Alzheimers Dement. 2010;6:239–46. - PMC - PubMed
    1. Albert MS, DeKosky ST, Dickson D, Dubois B, Feldman HH, et al. The diagnosis of mild cognitive impairment due to Alzheimer's disease: recommendations from the National Institute on Aging—Alzheimer's Association workgroups on diagnostic guidelines for Alzheimer's disease. Alzheimers Dement. 2011;7:270–79. - PMC - PubMed
    1. Alexander GE, Chen K, Pietrini P, Rapoport SI, Reiman EM. Longitudinal PET evaluation of cerebral metabolic decline in dementia: a potential outcome measure in Alzheimer's disease treatment studies. Am. J. Psychiatry. 2002;159:738–45. - PubMed
    1. Alsop DC, Dai W, Grossman M, Detre JA. Arterial spin labeling blood flow MRI: its role in the early characterization of Alzheimer's disease. J. Alzheimers Dis. 2010;20:871–80. - PMC - PubMed

Publication types

MeSH terms