. 2013 Jan;40(1):017501.
doi: 10.1118/1.4767757.

Deformable registration of the inflated and deflated lung in cone-beam CT-guided thoracic surgery: initial investigation of a combined model- and image-driven approach

Affiliations

Deformable registration of the inflated and deflated lung in cone-beam CT-guided thoracic surgery: initial investigation of a combined model- and image-driven approach

Ali Uneri et al. Med Phys. 2013 Jan.

Abstract

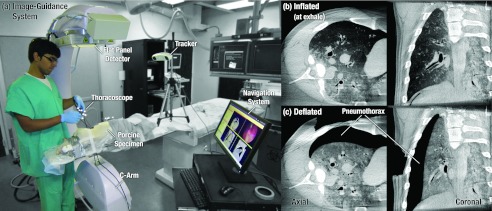
Purpose: Surgical resection is the preferred modality for curative treatment of early stage lung cancer, but localization of small tumors (<10 mm diameter) during surgery presents a major challenge that is likely to increase as more early-stage disease is detected incidentally and in low-dose CT screening. To overcome the difficulty of manual localization (fingers inserted through intercostal ports) and the cost, logistics, and morbidity of preoperative tagging (coil or dye placement under CT-fluoroscopy), the authors propose the use of intraoperative cone-beam CT (CBCT) and deformable image registration to guide targeting of small tumors in video-assisted thoracic surgery (VATS). A novel algorithm is reported for registration of the lung from its inflated state (prior to pleural breach) to the deflated state (during resection) to localize surgical targets and adjacent critical anatomy.

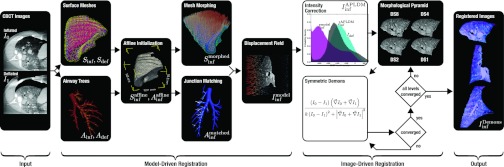
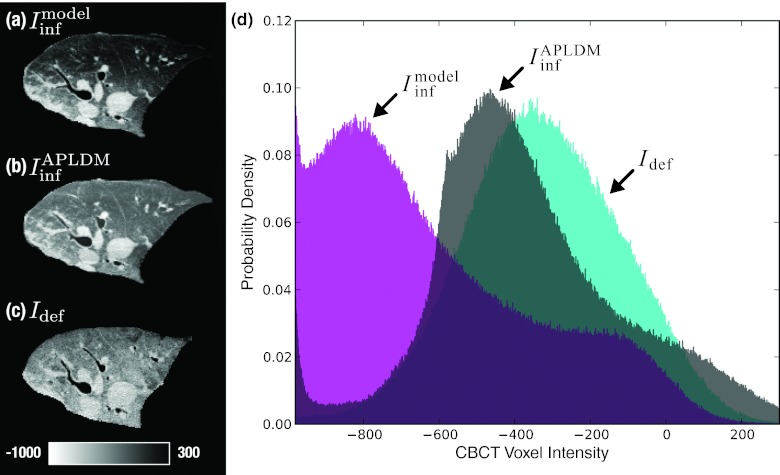
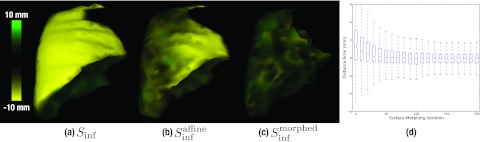
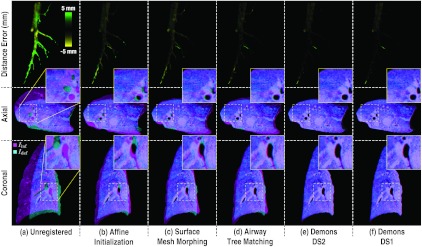
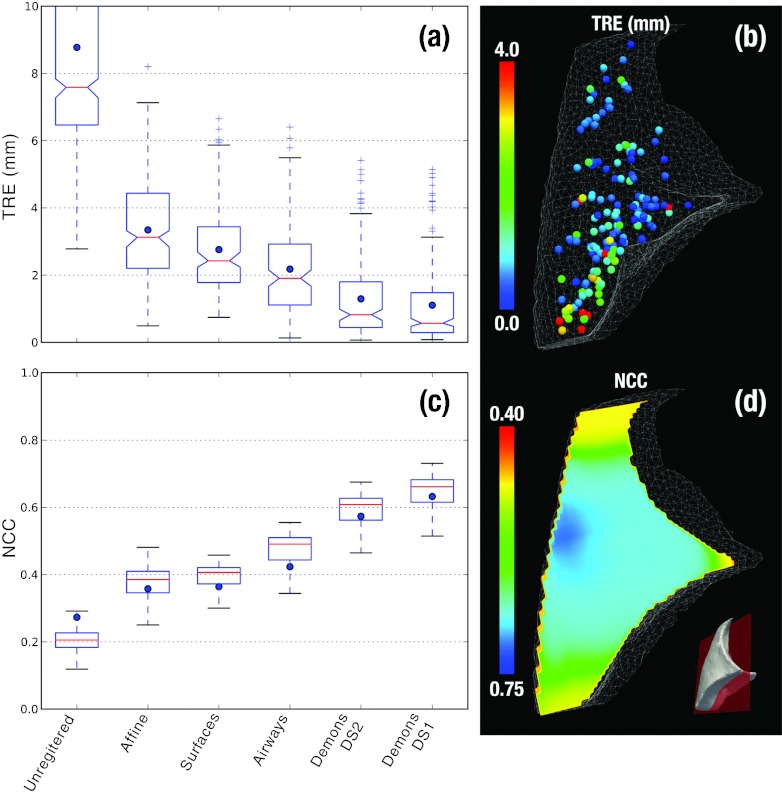
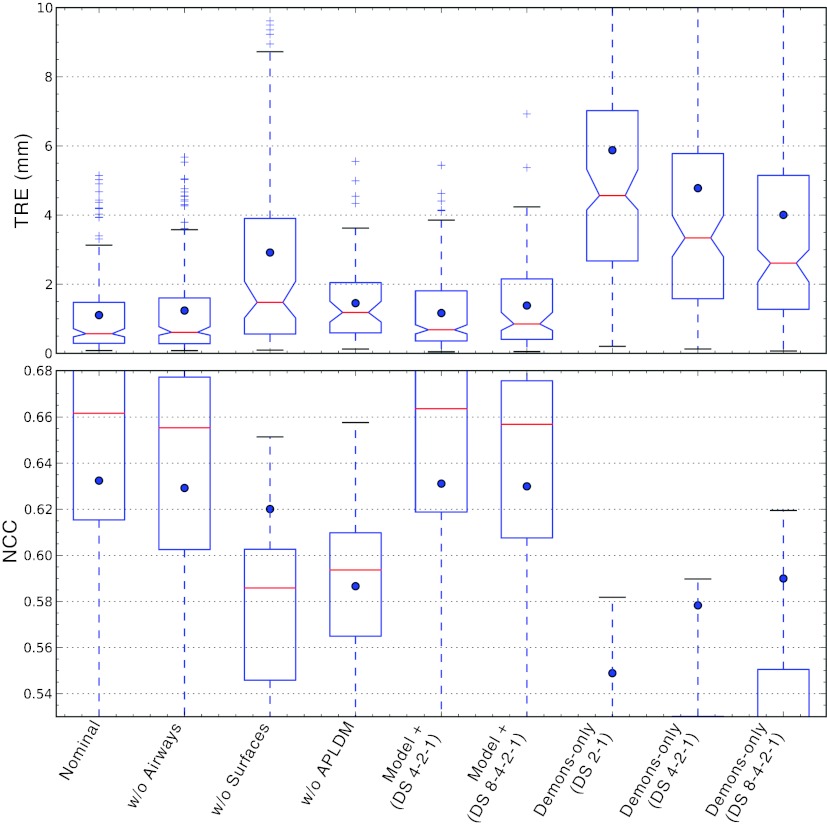
Methods: The registration approach geometrically resolves images of the inflated and deflated lung using a coarse model-driven stage followed by a finer image-driven stage. The model-driven stage uses image features derived from the lung surfaces and airways: triangular surface meshes are morphed to capture bulk motion; concurrently, the airways generate graph structures from which corresponding nodes are identified. Interpolation of the sparse motion fields computed from the bounding surface and interior airways provides a 3D motion field that coarsely registers the lung and initializes the subsequent image-driven stage. The image-driven stage employs an intensity-corrected, symmetric form of the Demons method. The algorithm was validated over 12 datasets, obtained from porcine specimen experiments emulating CBCT-guided VATS. Geometric accuracy was quantified in terms of target registration error (TRE) in anatomical targets throughout the lung, and normalized cross-correlation. Variations of the algorithm were investigated to study the behavior of the model- and image-driven stages by modifying individual algorithmic steps and examining the effect in comparison to the nominal process.

Results: The combined model- and image-driven registration process demonstrated accuracy consistent with the requirements of minimally invasive VATS in both target localization (∼3-5 mm within the target wedge) and critical structure avoidance (∼1-2 mm). The model-driven stage initialized the registration to within a median TRE of 1.9 mm (95% confidence interval (CI) maximum = 5.0 mm), while the subsequent image-driven stage yielded higher accuracy localization with 0.6 mm median TRE (95% CI maximum = 4.1 mm). The variations assessing the individual algorithmic steps elucidated the role of each step and in some cases identified opportunities for further simplification and improvement in computational speed.

Conclusions: The initial studies show the proposed registration method to successfully register CBCT images of the inflated and deflated lung. Accuracy appears sufficient to localize the target and adjacent critical anatomy within ∼1-2 mm and guide localization under conditions in which the target cannot be discerned directly in CBCT (e.g., subtle, nonsolid tumors). The ability to directly localize tumors in the operating room could provide a valuable addition to the VATS arsenal, obviate the cost, logistics, and morbidity of preoperative tagging, and improve patient safety. Future work includes in vivo testing, optimization of workflow, and integration with a CBCT image guidance system.


Figures

Figure 1
Figure 1
(a) Image-guidance system used during a thoracic surgery experiment performed on a fresh cadaveric porcine specimen. CBCT images illustrate the target lung in (b) inflated and (c) deflated states. Deflation of the lung imparts a large deformation in which the lung collapses from the chest wall toward the mediastinum, creating a pneumothorax between the lateral lung surface and two or more intercostal ports.
Figure 2
Figure 2
Overview of the proposed algorithm for deformable registration of the inflated and deflated lung. The two main stages of the method are: (1) a coarse model-driven registration using surface and airway structures; followed by (2) a fine image-driven registration using an intensity-corrected Demons algorithm. The hybrid model- and image-driven approach was hypothesized to give robust, adaptable registration with geometric accuracy suitable either for coarse localization of the target wedge (with model-driven stage only) and/or localization of the target nodule and adjacent critical anatomy (with model- and image-driven stages).
Figure 3
Figure 3
Triangulated surface meshes generated from (a) the inflated lung image Iinf (surface denoted Sinf) and (b) the deflated lung image Idef (surface denoted Sdef), with corners of the axis-aligned bounding boxes highlighted.
Figure 4
Figure 4
Airway trees and corresponding nodes. (a) Surface renderings showing overlay of the bronchial airways A inf affine and Adef. (b) The resulting graph structure highlights the extracted midline, the nodes identified at each junction point, and the nodes for which correspondence was identified between the A inf affine and Adef trees.
Figure 5
Figure 5
Correction of CBCT image intensities using APLDM. Axial slices show (a) I inf model , (b) the intensity-corrected version of the moving image, I inf APLDM , and (c) the target image Idef. The mean intensity increase in (c) is due to expulsion of air upon deflation and buildup of fluid (edema) during intervention. (d) Normalized image histograms show the shift in voxel intensities for the APLDM-corrected image.
Figure 6
Figure 6
Signed distance errors between the target surface, Sdef, and (a) the unregistered surface Sinf, (b) the affine-registered surface S inf affine , and (c) following surface morphing S inf morphed . The boxplot in (d) shows the distribution of signed distance error for all vertices over surface morphing iterations. For all boxplots herein, the horizontal line marks the median value, the upper and lower bound of the rectangle mark the third quartile range of the data, and the whiskers mark the full data range excluding outliers.
Figure 7
Figure 7
Registration performance at key steps in the algorithm. The top row shows the signed distance error in airway trees, Ainf and Adef. Axial and coronal slice overlays showing alignment of Iinf (magenta) and Idef (cyan) at each step of the algorithm. The zoomed inset in each case gives qualitative visualization of structure alignment.
Figure 8
Figure 8
TRE and NCC computed at key steps of the algorithm. (a) Distribution of TRE at each step in the algorithm, with blue dots marking the mean error. Outliers marked as “+” were measurements outside 1.5 × the standard deviation of the distributions. (b) 3D illustration of the 150 target points used in analysis of TRE, with the color bar conveying the final TRE. (c) Distribution of LNCC computed over a moving window over the images at each step of the algorithm. Blue dots mark the global NCC computed over the entire lung, and boxplots show median, quartile, and range of LNCC. (d) A coronal slice showing the final LNCC following model + image-driven registration.
Figure 9
Figure 9
Variations on the registration process detailed in Sec. 2B. (Top) TRE distributions with dots marking the mean, and (bottom) LNCC distributions computed from a moving window within the lung, with dots marking the global NCC computed over the entire lung.

References

    1. Siegel R., Naishadham D, and Jemal A., “Cancer statistics,” Ca-Cancer J. Clin. 62(1), 10–29 (2012).10.3322/caac.20138 - DOI - PubMed
    1. Jemal A. et al., “Global cancer statistics,” Ca-Cancer J. Clin. 61(2), 69–90 (2011).10.3322/caac.20107 - DOI - PubMed
    1. Swensen S. J. et al., “Screening for lung cancer with low-dose spiral computed tomography,” Am. J. Respir. Crit. Care Med. 165(4), 508–513 (2002).10.1164/rccm.2107006 - DOI - PubMed
    1. Swensen S. J. et al., “CT screening for lung cancer: Five-year prospective experience,” Radiology 235(1), 259–65 (2005).10.1148/radiol.2351041662 - DOI - PubMed
    1. Mikita K. et al., “Growth rate of lung cancer recognized as small solid nodule on initial CT findings,” Eur. J. Radiol. 81(4), e548–e553 (2012).10.1016/j.ejrad.2011.06.032 - DOI - PubMed

Publication types

MeSH terms