. 2013 Jan 8:8:4.
doi: 10.1186/1750-1172-8-4.

Brain damage in methylmalonic aciduria: 2-methylcitrate induces cerebral ammonium accumulation and apoptosis in 3D organotypic brain cell cultures

Affiliations

Brain damage in methylmalonic aciduria: 2-methylcitrate induces cerebral ammonium accumulation and apoptosis in 3D organotypic brain cell cultures

Paris Jafari et al. Orphanet J Rare Dis. .

Abstract

Background: Methylmalonic aciduria is an inborn error of metabolism characterized by accumulation of methylmalonate (MMA), propionate and 2-methylcitrate (2-MCA) in body fluids. Early diagnosis and current treatment strategies aimed at limiting the production of these metabolites are only partially effective in preventing neurological damage.

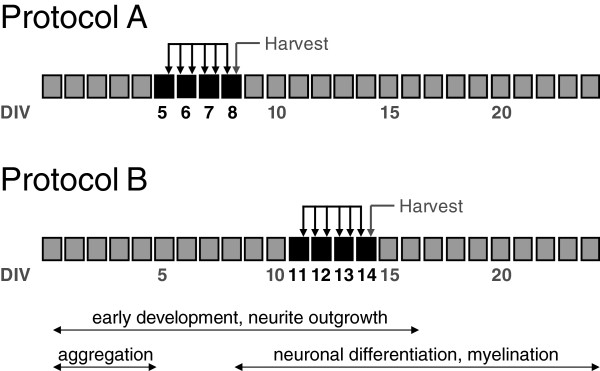
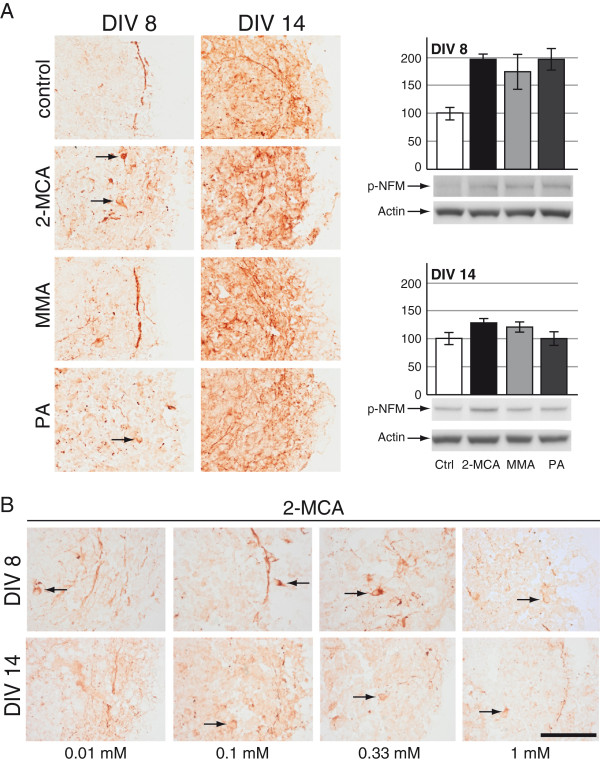
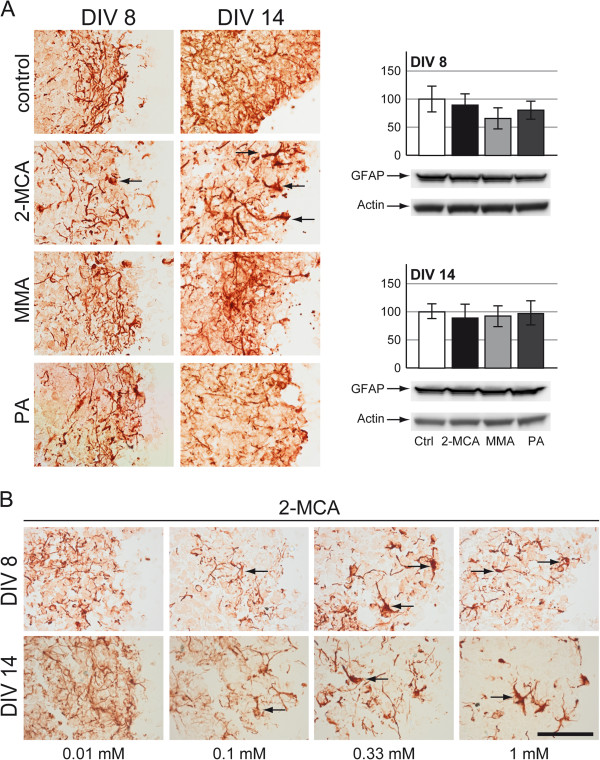
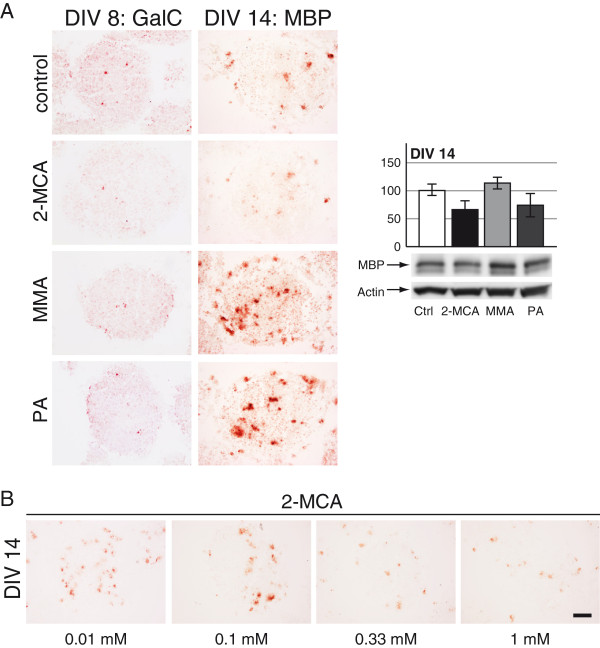
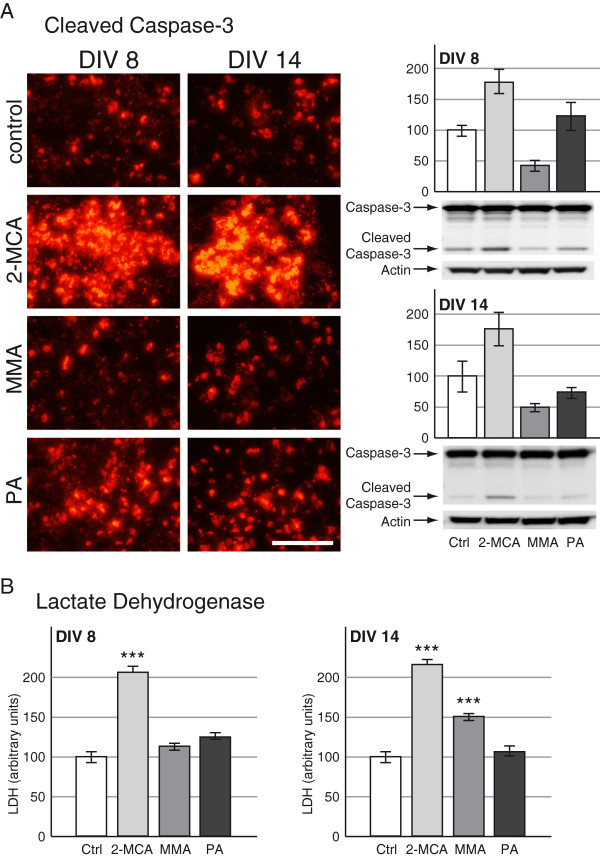
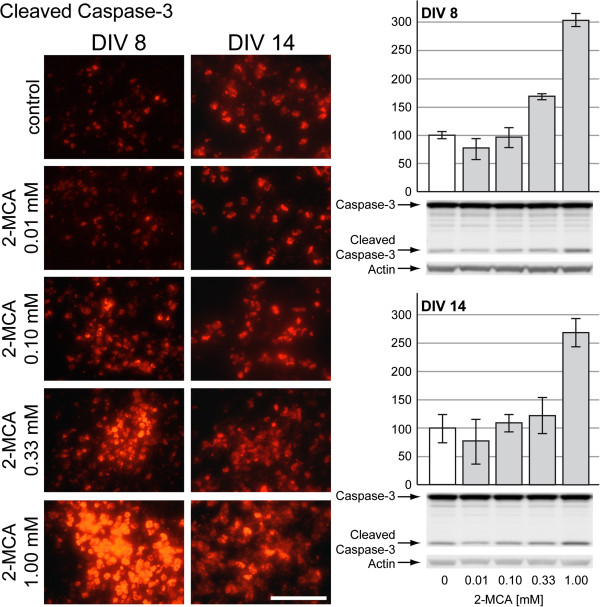
Methods: To explore the metabolic consequences of methylmalonic aciduria on the brain, we used 3D organotypic brain cell cultures from rat embryos. We challenged the cultures at two different developmental stages with 1 mM MMA, propionate or 2-MCA applied 6 times every 12 h. In a dose-response experiment cultures were challenged with 0.01, 0.1, 0.33 and 1 mM 2-MCA. Immunohistochemical staining for different brain cell markers were used to assess cell viability, morphology and differentiation. Significant changes were validated by western blot analysis. Biochemical markers were analyzed in culture media. Apoptosis was studied by immunofluorescence staining and western blots for activated caspase-3.

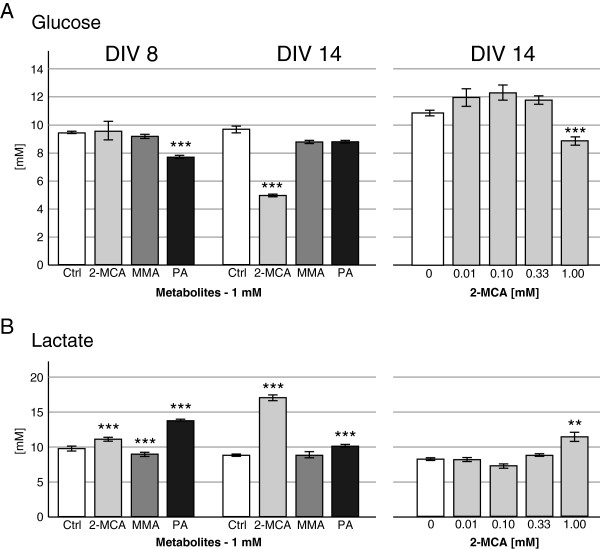
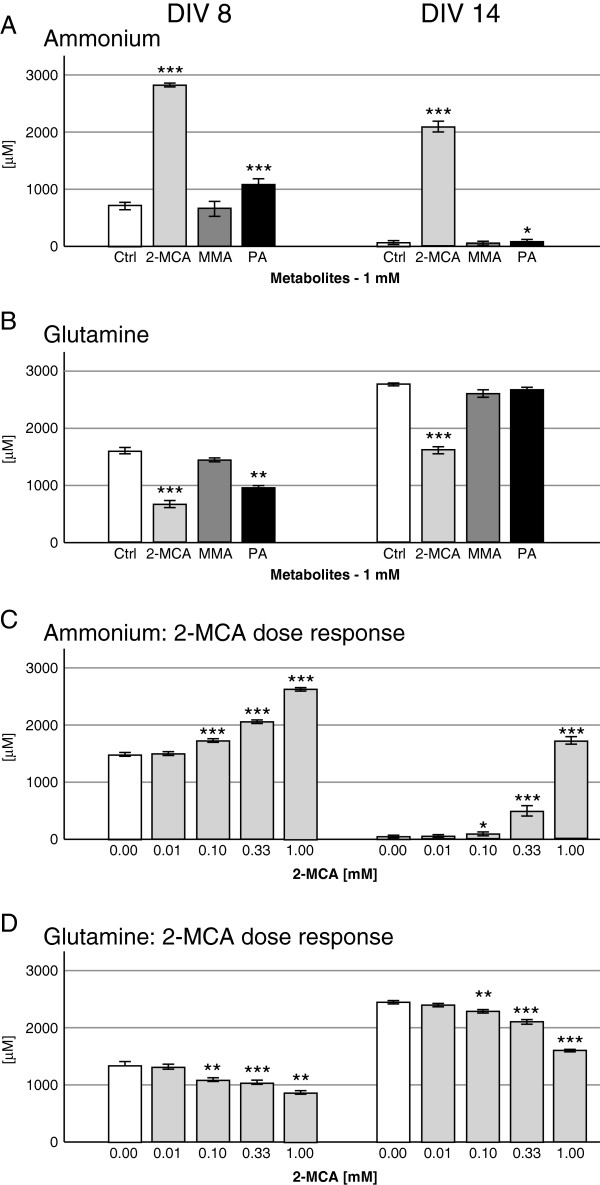
Results: Among the three metabolites tested, 2-MCA consistently produced the most pronounced effects. Exposure to 2-MCA caused morphological changes in neuronal and glial cells already at 0.01 mM. At the biochemical level the most striking result was a significant ammonium increase in culture media with a concomitant glutamine decrease. Dose-response studies showed significant and parallel changes of ammonium and glutamine starting from 0.1 mM 2-MCA. An increased apoptosis rate was observed by activation of caspase-3 after exposure to at least 0.1 mM 2-MCA.

Conclusion: Surprisingly, 2-MCA, and not MMA, seems to be the most toxic metabolite in our in vitro model leading to delayed axonal growth, apoptosis of glial cells and to unexpected ammonium increase. Morphological changes were already observed at 2-MCA concentrations as low as 0.01 mM. Increased apoptosis and ammonium accumulation started at 0.1 mM thus suggesting that ammonium accumulation is secondary to cell suffering and/or cell death. Local accumulation of ammonium in CNS, that may remain undetected in plasma and urine, may therefore play a key role in the neuropathogenesis of methylmalonic aciduria both during acute decompensations and in chronic phases. If confirmed in vivo, this finding might shift the current paradigm and result in novel therapeutic strategies.


Figures

Figure 1
Figure 1
Treatment protocols. Brain cell aggregates were exposed to 1 mM 2-MCA, MMA and PA or lower concentrations of 2-MCA at two time points representing different developmental stages of brain cell maturation (Protocols A and B). Metabolites were added 6 times every 12 hours (indicated by arrows) starting on DIV 5 in protocol A and on DIV 11 in protocol B (treatment DIVs are indicated by black boxes) 12 hours after the change of the medium. Aggregates were harvested 5 hours after the last treatment on DIV 8 in protocol A and on DIV 14 in protocol B.
Figure 2
Figure 2
Effects of 2-MCA, MMA and PA on neurons. Immunohistochemical staining for phosphorylated medium weight neurofilament (p-NFM) on cryosections of cultures derived from DIV 8 and DIV 14. Cultures were exposed to 1 mM 2-MCA, MMA or PA (A; left panel) or lower concentrations of 2-MCA (B). Stained cell bodies are indicated by black arrows. Scale bar: 100 μm. A; right panel: Representative western blots with data quantification of whole-cell lysates for p-NFM on DIV 8 (above) and on DIV 14 (below). Actin was used as a loading control. The quantifications of p-NFM normalized to actin are expressed as percentage of respective controls. The values represent the mean ± SEM from three replicates taken from two independent experiments.
Figure 3
Figure 3
Effects of 2-MCA, MMA and PA on astrocytes. Immunohistochemical staining for glial fibrillary acidic protein (GFAP) on cryosections of cultures on DIV 8 and 14. Cultures were exposed to 1 mM 2-MCA, MMA or PA (A; left panel) or lower concentrations of 2-MCA (B). Swollen proximal fibers are indicated by black arrows. Scale bar: 100 μm. A; right panel: Representative western blots with data quantification of whole-cell lysates for GFAP on DIV 8 (above) and on DIV 14 (below). Actin was used as a loading control. The quantifications of GFAP levels normalized to actin are expressed as percentage of respective controls. The values represent the mean ± SEM from three replicates taken from two independent experiments.
Figure 4
Figure 4
Effects of 2-MCA, MMA and PA on oligodendrocytes. Immunohistochemical staining for galactocerebroside (GalC, DIV 8) and myelin basic protein (MBP, DIV 14) on cryosections of cultures on DIV 8 and 14. Cultures were exposed to 1 mM 2-MCA, MMA or PA (A; left panel) or lower concentrations of 2-MCA (B). Scale bar: 100 μm. A; right panel: Representative western blots with data quantification of whole-cell lysates for MBP on DIV 14. Actin was used as a loading control. The quantifications of MBP levels normalized to actin are expressed as percentage of respective controls. The values represent the mean ± SEM from three replicates taken from two independent experiments.
Figure 5
Figure 5
Effects of 2-MCA, MMA and PA on glucose and lactate levels. Glucose (A) and lactate (B) were measured in the medium of cultures from DIV 8 and DIV 14. Cultures were exposed to 1 mM 2-MCA, MMA or PA (A and B; left panel, DIV 8 and 14) or lower concentrations of 2-MCA (A and B; right panel, DIV 14). Mean ± SEM of 4 to 7 replicate cultures assessed by Student’s t-test; **p<0.01, *** p<0.001.
Figure 6
Figure 6
Effects of 2-MCA, MMA and PA on ammonium and glutamine levels. Ammonium (A and C) and glutamine (B and D) were measured in the medium of cultures from DIV 8 and DIV 14. Cultures were exposed to 1 mM 2-MCA, MMA or PA (A and B) or lower concentrations of 2-MCA (C and D). Mean ± SEM of 4 to 7 replicate cultures assessed by Student’s t-test; *p<0.05, **p<0.01, *** p<0.001.
Figure 7
Figure 7
Evaluation of cell death after exposure to 2-MCA, MMA and PA. A; left panel: Immunohistochemical staining for cleaved caspase-3 (red signal). Scale bar: 100 μm. A; right panel: Representative western blots with data quantification of whole-cell lysates for full length caspase-3 and the large fragment of cleaved caspase-3 (i.e. activated caspase-3) on DIV 8 (left) and on DIV 14 (right). Actin was used as a loading control. The quantifications of cleaved caspase-3 normalized to actin are expressed as percentage of respective controls. The values represent the mean ± SEM from three replicates taken from two independent experiments. B: LDH in culture medium of cultures from DIV 8 (left) and DIV 14 (right). Mean ± SEM of seven replicate cultures assessed by Student’s t-test; *** p<0.001.
Figure 8
Figure 8
Evaluation of cell death after exposure to with lower concentrations of 2-MCA. Left panel: Immunohistochemical staining for cleaved caspase-3 (red signal). Scale bar: 100 μm. Right panel: Representative western blots with data quantification of whole-cell lysates for full length caspase-3 and the large fragment of cleaved caspase-3 (i.e. activated caspase-3) for DIV 8 (above) and DIV 14 (below). Actin was used as a loading control. The quantifications of cleaved caspase-3 normalized to actin are expressed as percentage of respective controls. The values represent the mean ± SEM from three replicates.

References

    1. Willard HF, Rosenberg LE. Inherited methylmalonyl CoA mutase apoenzyme deficiency in human fibroblasts: evidence for allelic heterogeneity, genetic compounds, and codominant expression. J Clin Invest. 1980;65:690–698. doi: 10.1172/JCI109715. - DOI - PMC - PubMed
    1. Lempp TJ, Suormala T, Siegenthaler R, Baumgartner ER, Fowler B, Steinmann B, Baumgartner MR. Mutation and biochemical analysis of 19 probands with mut0 and 13 with mut- methylmalonic aciduria: identification of seven novel mutations. Mol Genet Metab. 2007;90:284–290. doi: 10.1016/j.ymgme.2006.10.002. - DOI - PubMed
    1. Dobson CM, Wai T, Leclerc D, Wilson A, Wu X, Dore C, Hudson T, Rosenblatt DS, Gravel RA. Identification of the gene responsible for the cblA complementation group of vitamin B12-responsive methylmalonic acidemia based on analysis of prokaryotic gene arrangements. Proc Natl Acad Sci U S A. 2002;99:15554–15559. doi: 10.1073/pnas.242614799. - DOI - PMC - PubMed
    1. Dobson CM, Wai T, Leclerc D, Kadir H, Narang M, Lerner-Ellis JP, Hudson TJ, Rosenblatt DS, Gravel RA. Identification of the gene responsible for the cblB complementation group of vitamin B12-dependent methylmalonic aciduria. Hum Mol Genet. 2002;11:3361–3369. doi: 10.1093/hmg/11.26.3361. - DOI - PubMed
    1. Zwickler T, Haege G, Riderer A, Hörster F, Hoffmann GF, Burgard P, Kölker S. Metabolic decompensation in methylmalonic aciduria: which biochemical parameters are discriminative? J Inherit Metab Dis. 2012;35:797–806. doi: 10.1007/s10545-011-9426-1. - DOI - PubMed

Publication types