. 2013 Jan 8:6:3.
doi: 10.1186/1756-6606-6-3.

Time-dependent changes in the microenvironment of injured spinal cord affects the therapeutic potential of neural stem cell transplantation for spinal cord injury

Affiliations

Time-dependent changes in the microenvironment of injured spinal cord affects the therapeutic potential of neural stem cell transplantation for spinal cord injury

Soraya Nishimura et al. Mol Brain. .

Abstract

Background: The transplantation of neural stem/progenitor cells (NS/PCs) at the sub-acute phase of spinal cord injury, but not at the chronic phase, can promote functional recovery. However, the reasons for this difference and whether it involves the survival and/or fate of grafted cells under these two conditions remain unclear. To address this question, NS/PC transplantation was performed after contusive spinal cord injury in adult mice at the sub-acute and chronic phases.

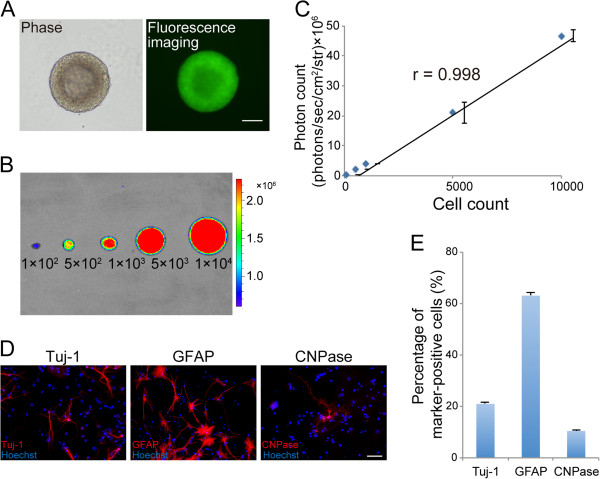
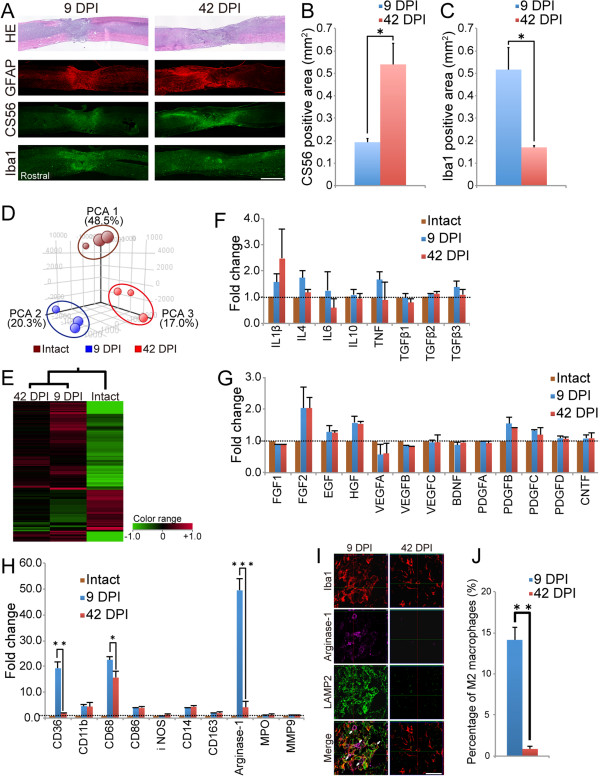
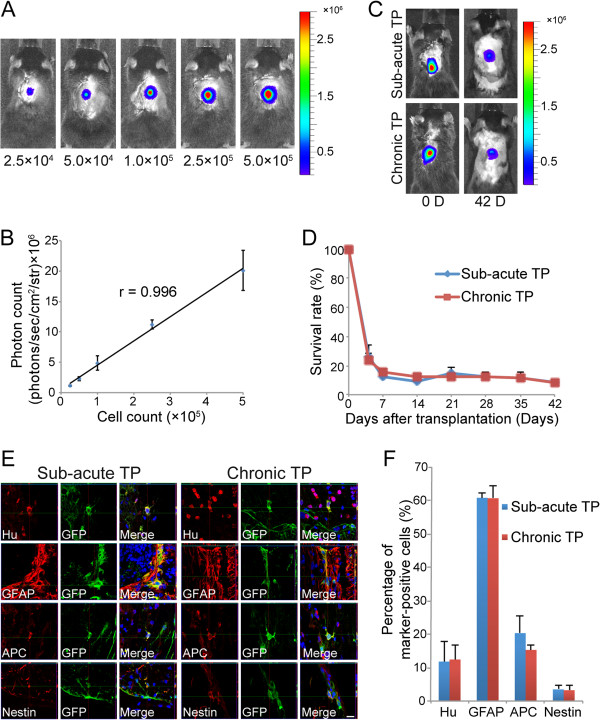
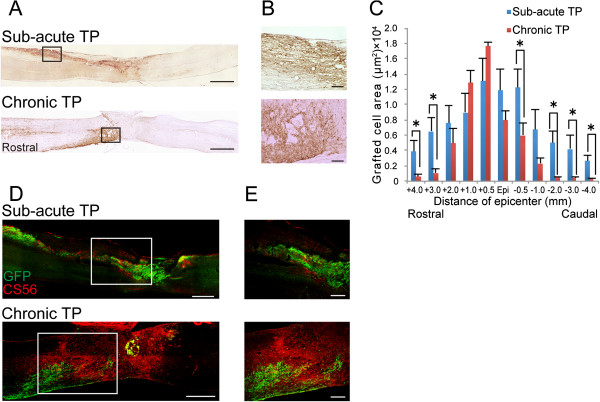
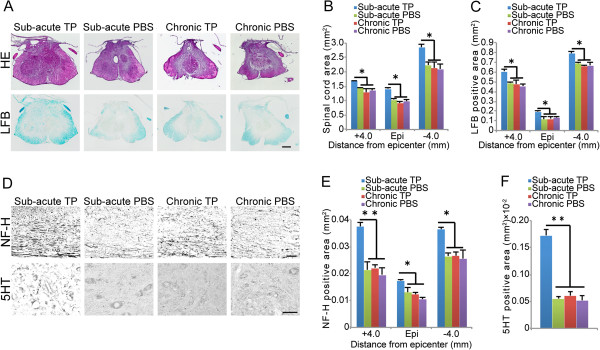
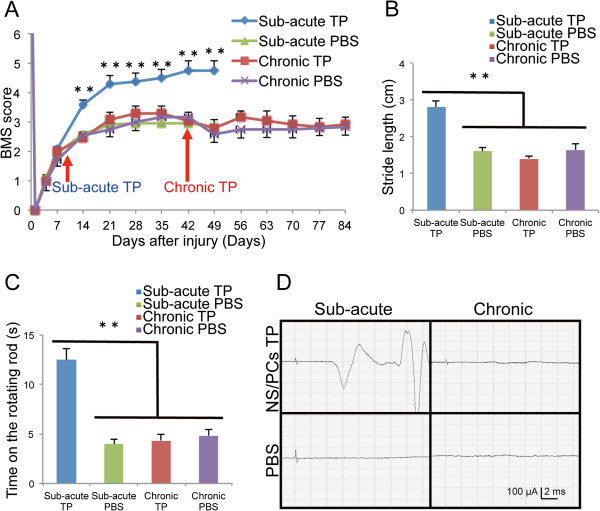
Results: Quantitative analyses using bio-imaging, which can noninvasively detect surviving grafted cells in living animals, revealed no significant difference in the survival rate of grafted cells between the sub-acute and chronic transplantation groups. Additionally, immunohistology revealed no significant difference in the differentiation phenotypes of grafted cells between the two groups. Microarray analysis revealed no significant differences in the expression of genes encoding inflammatory cytokines or growth factors, which affect the survival and/or fate of grafted cells, in the injured spinal cord between the sub-acute and chronic phases. By contrast, the distribution of chronically grafted NS/PCs was restricted compared to NS/PCs grafted at the sub-acute phase because a more prominent glial scar located around the lesion epicenter enclosed the grafted cells. Furthermore, microarray and histological analysis revealed that the infiltration of macrophages, especially M2 macrophages, which have anti-inflammatory role, was significantly higher at the sub-acute phase than the chronic phase. Ultimately, NS/PCs that were transplanted in the sub-acute phase, but not the chronic phase, promoted functional recovery compared with the vehicle control group.

Conclusions: The extent of glial scar formation and the characteristics of inflammation is the most remarkable difference in the injured spinal cord microenvironment between the sub-acute and chronic phases. To achieve functional recovery by NS/PC transplantation in cases at the chronic phase, modification of the microenvironment of the injured spinal cord focusing on glial scar formation and inflammatory phenotype should be considered.


Figures

Figure 1
Figure 1
In vitro characterization of the NS/PCs derived from transgenic mice that ubiquitously express ffLuc-cp156. A, Fluorescence image showing NS/PCs derived from fetal transgenic mice expressing the fluorescent protein cp156-Venus, which is originally modified from GFP. B, Bioluminescent signals originating from the luciferase were detected in the NS/PCs by BLI. C, The number of NS/PCs was significantly correlated with the measured photon count by BLI. Values are means ± SEM (n = 3). D, Tertiary NS/PCs differentiated into Tuj-1+ neurons, GFAP+ astrocytes, and CNPase+ oligodendrocytes in vitro. E, Quantitative analysis of Tuj-1+ neurons, GFAP+ astrocytes, and CNPase+ oligodendrocytes in vitro. Values are means ± SEM (n = 5). Scale bar: 100 μm in (A) and 50 μm in (D).
Figure 2
Figure 2
Comparison of the microenvironment of the injured spinal cord at 9 DPI versus 42 DPI. A, Representative images of HE staining and immunofluorescence staining for GFAP, CS56, and Iba1 in sagittal sections. B, CSPGs accumulation was more prominent at the lesion site at 42 DPI than at 9 DPI. Values are means ± SEM (n = 3). *P < 0.05. C, More Iba1-positive cells were distributed at the lesion site at 9 DPI than at 42 DPI. Values are means ± SEM (n = 3). *P < 0.05. D, Overview of all the microarray data by PCA. The samples of each group were clustered at different locations on 3D visualization. E, Hierarchical clustering analysis showed that the gene expression pattern at 9 DPI was similar to that at 42 DPI. However, the magnitude of changes in gene expression differed between the two injury groups. Green tiles show downregulated genes and red tiles indicate upregulated genes. F-H, Gene expression signals of cytokines (F), growth factors (G), and markers of inflammatory cells (H) at 9 DPI and 42 DPI. The gene expression levels of markers associated with microglia/macrophages significantly differed between 9 DPI and 42 DPI, but those of all cytokines and growth factors did not. Data are the mean fold-change values versus intact samples. Values are means ± SEM (n = 3). *P < 0.05, **P < 0.01, ***P < 0.001. I, Representative images of immunofluorescence staining for Iba1, arginase-1, and LAMP2 in sagittal sections of the lesion epicenter at 9 DPI and 42 DPI. Arrows: Iba1+/arginase-1+/LAMP2+ triple-positive cells. J, At the lesion epicenter, more Iba1+/arginase-1+ M2 macrophages had infiltrated at 9 DPI compared with 42 DPI. Values are means ± SEM (n = 3). **P < 0.01. Scale bar: 1000 μm in (A) and 50 μm in (J).
Figure 3
Figure 3
Survival rate and differentiation phenotype of grafted cells in the sub-acute and chronic TP groups. A, Representative in vivo BLI of naïve mice transplanted with various numbers of NS/PCs. B, The number of NS/PCs and the measured photon count were significantly correlated in vivo. Values are means ± SEM (n = 3). C, Representative in vivo BLI of the sub-acute and chronic TP groups immediately and 42 days after transplantation. D, Quantitative analysis using BLI revealed no significant difference in the survival rate of grafted cells between the sub-acute and chronic TP groups up to 42 days after transplantation. Values are means ± SEM (n = 10). E, GFP+ grafted cells differentiated into Hu+ neurons, GFAP+ astrocytes, and APC+ oligodendrocytes in the sub-acute and chronic TP groups. F, The differentiation rate of grafted cells into the three neural cell lineages did not significantly differ between the sub-acute and chronic TP groups 42 days after transplantation. Only a small number of nestin+ neural progenitor cells was detected in the sub-acute and chronic TP groups. Values are means ± SEM (n = 3). Scale bar: 10 μm in (C).
Figure 4
Figure 4
Distribution of grafted cells in the sub-acute and chronic TP groups. A, Representative images of GFP-immunostained sagittal sections in the sub-acute and chronic TP groups 42 days after transplantation. B, Higher-magnification images of the boxed areas in (A). C, Quantitative analysis of the GFP+ grafted cell area in axial sections 42 days after transplantation. Grafted cells were located at the epicenter, rostral, and caudal sites in the sub-acute TP group, whereas they were limited to the lesion epicenter in the chronic TP group. Values are means ± SEM (n = 4). *P < 0.05. D, Representative images of GFP- and CS56-immunostained sagittal sections from the sub-acute and chronic TP groups. E, Higher-magnification images of the boxed area in (D). In the sub-acute TP group, the GFP+ grafted cells migrated away from the graft site due to less accumulation of CS56+ CSPG around the lesion site, while the robust CSPGs prevented further migration of the grafted cells in the chronic TP group. Scale bar: 1000 μm in (A), 100 μm in (B), 500 μm in (D) and 200 μm in (E).
Figure 5
Figure 5
Comparison of the effects of NS/PC transplantation between the sub-acute and chronic TP groups. A, Representative HE- and LFB-stained images of axial sections at the lesion epicenter in the sub-acute TP, chronic TP, and both control groups. B, Significant atrophy of the spinal cords was observed in the chronic TP and control groups compared to that of the sub-acute TP group. Values are means ± SEM (n = 3). *P < 0.05. C, The sub-acute TP group demonstrated a significantly larger myelinated area than the chronic TP and control groups. Values are means ± SEM (n = 3). *P < 0.05. D, Representative images of sagittal sections stained for NF-H at the rim of the lesion epicenter and of axial sections stained for 5HT at the lumbar intumescence in the sub-acute TP, chronic TP, and each control group. E, Greater area of NF-H+ neuronal fibers was observed in the sub-acute TP group than in the chronic TP group or control groups. Values are means ± SEM (n = 3). *P < 0.05, **P < 0.01. F, Significantly larger areas of 5HT+ serotonergic fibers were detected in the sub-acute TP group than in the chronic TP or control groups. Values are means ± SEM (n = 3). **P < 0.01. Scale bar: 100 μm in (A) and (D).
Figure 6
Figure 6
Motor function and electrophysiological recovery after NS/PC transplantation. A, Hindlimb motor function was assessed weekly by BMS score. The sub-acute TP group exhibited significantly better functional recovery than the vehicle control group at 14 DPI and thereafter, whereas no significant difference was observed between the chronic TP group and the vehicle control group. Values are means ± SEM (n = 10). **P < 0.01. B, Treadmill gait analysis using the DigiGait system revealed a significantly longer stride in the sub-acute TP group than in the chronic TP group or either control group 42 days after cell transplantation or PBS injection. Values are means ± SEM (sub-acute TP n = 10, chronic TP and each control n = 8). **P < 0.01. C, The sub-acute TP group walked for a significantly longer time on the rotating rod than the chronic TP group or either control group 42 days after cell transplantation or PBS injection. Values are means ± SEM (n = 10). **P < 0.01. D, Representative profiles of MEP in the sub-acute TP, chronic TP, and both control groups 42 days after cell transplantation or PBS injection.

References

    1. Ogawa Y, Sawamoto K, Miyata T, Miyao S, Watanabe M, Nakamura M, Bregman BS, Koike M, Uchiyama Y, Toyama Y, Okano H. Transplantation of in vitro-expanded fetal neural progenitor cells results in neurogenesis and functional recovery after spinal cord contusion injury in adult rats. J Neurosci Res. 2002;69:925–933. doi: 10.1002/jnr.10341. - DOI - PubMed
    1. Cummings BJ, Uchida N, Tamaki SJ, Salazar DL, Hooshmand M, Summers R, Gage FH, Anderson AJ. Human neural stem cells differentiate and promote locomotor recovery in spinal cord-injured mice. Proc Natl Acad Sci USA. 2005;102:14069–14074. doi: 10.1073/pnas.0507063102. - DOI - PMC - PubMed
    1. Hofstetter CP, Holmström NAV, Lilja JA, Schweinhardt P, Hao J, Spenger C, Wiesenfeld-Hallin Z, Kurpad SN, Frisén J, Olson L. Allodynia limits the usefulness of intraspinal neural stem cell grafts; directed differentiation improves outcome. Nat Neurosci. 2005;8:346–353. doi: 10.1038/nn1405. - DOI - PubMed
    1. Okada S, Ishii K, Yamane J, Iwanami A, Ikegami T, Katoh H, Iwamoto Y, Nakamura M, Miyoshi H, Okano HJ, Contag CH, Toyama Y, Okano H. In vivo imaging of engrafted neural stem cells: its application in evaluating the optimal timing of transplantation for spinal cord injury. FASEB J. 2005;19:1839–1841. - PubMed
    1. Cao QL, Zhang YP, Howard RM, Walters WM, Tsoulfas P, Whittemore SR. Pluripotent stem cells engrafted into the normal or lesioned adult rat spinal cord are restricted to a glial lineage. Exp Neurol. 2001;167:48–58. doi: 10.1006/exnr.2000.7536. - DOI - PubMed

Publication types

MeSH terms