. 2013 Mar;9(3):328-44.
doi: 10.4161/auto.22971. Epub 2013 Jan 8.

Upregulated autophagy protects cardiomyocytes from oxidative stress-induced toxicity

Affiliations

Upregulated autophagy protects cardiomyocytes from oxidative stress-induced toxicity

Debapriya Dutta et al. Autophagy. 2013 Mar.

Abstract

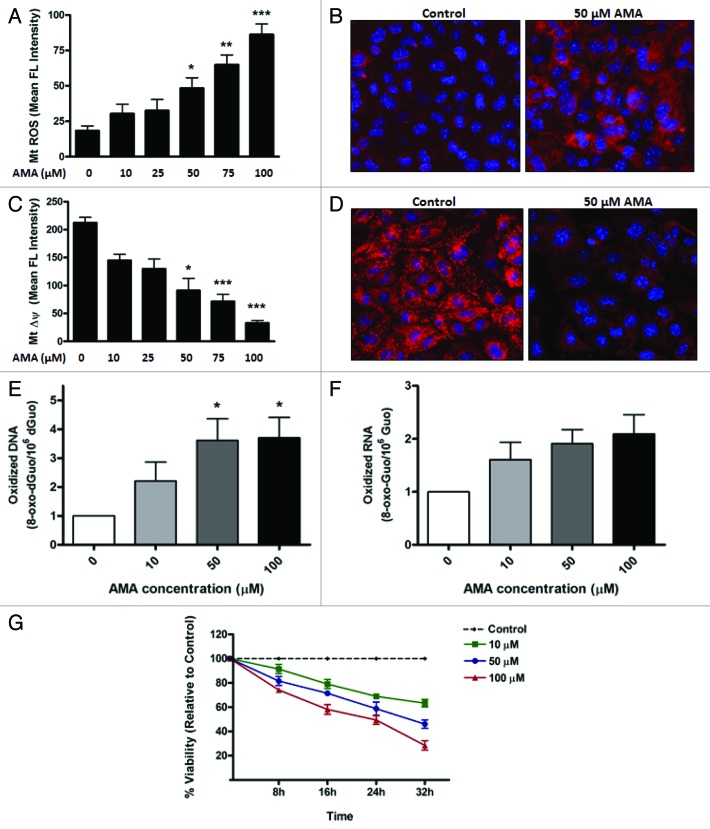
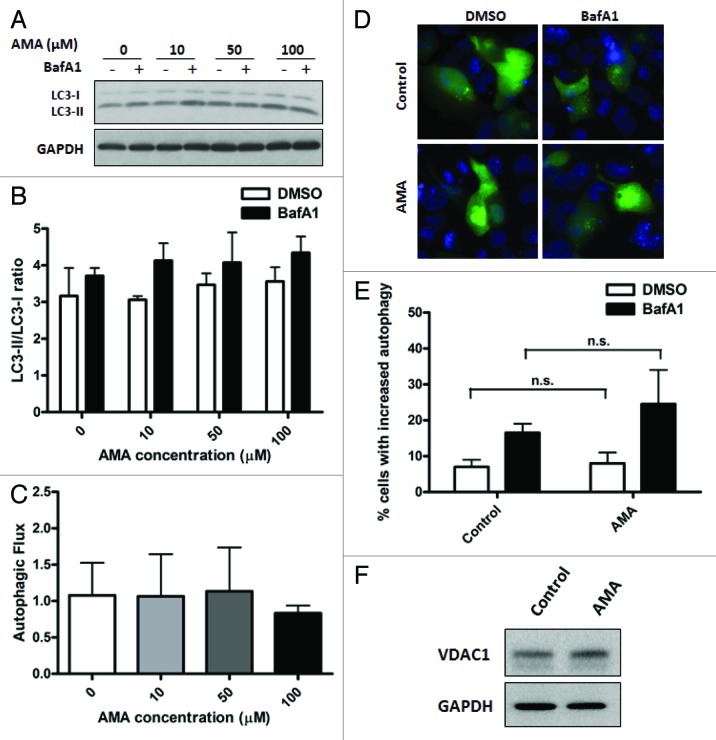
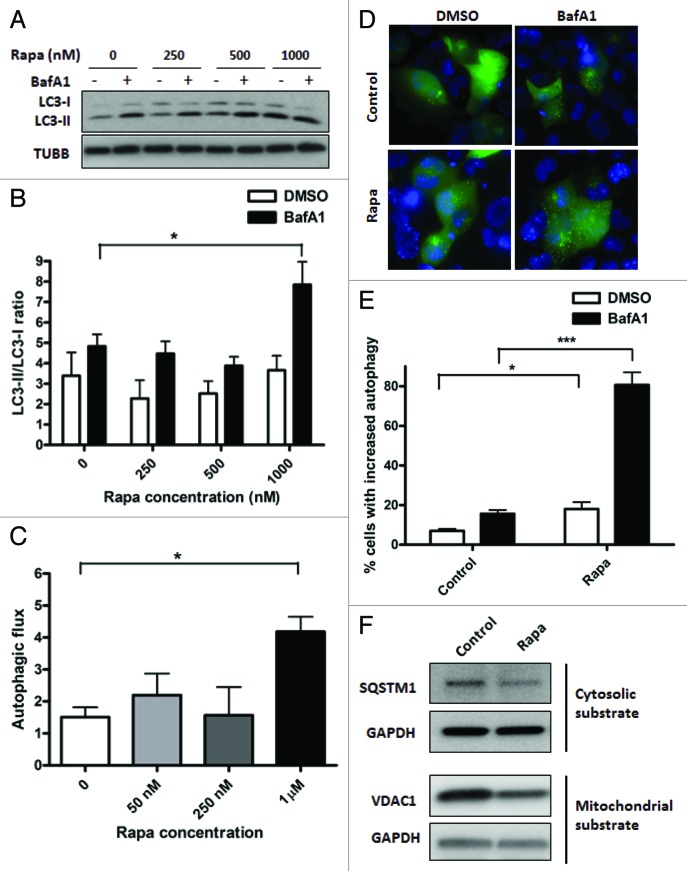
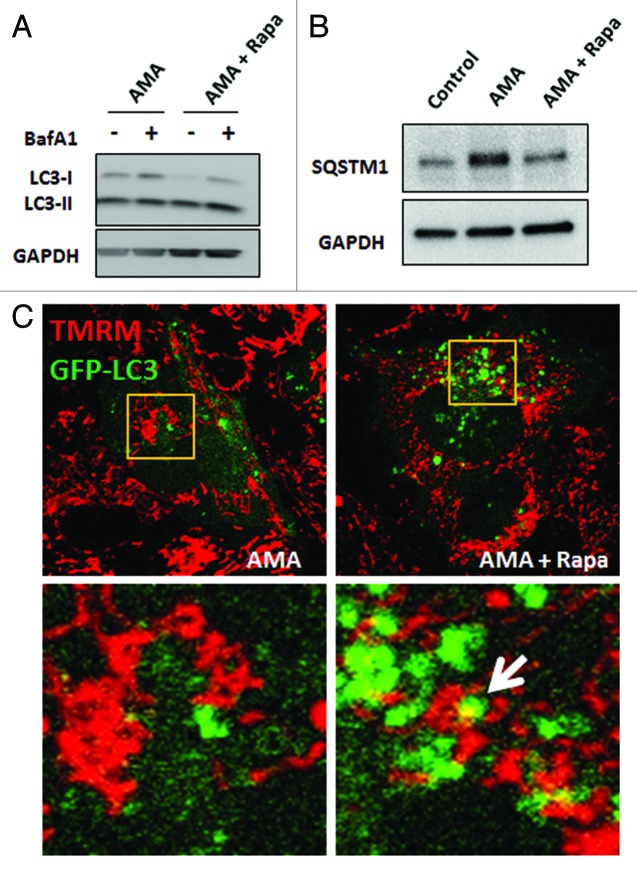
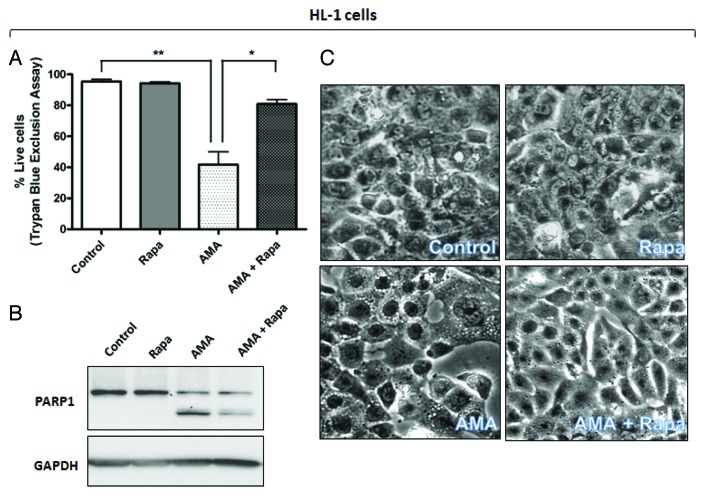
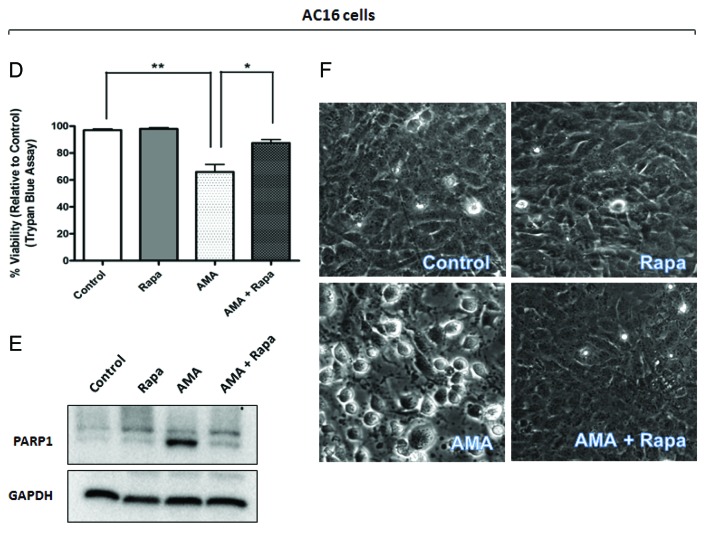
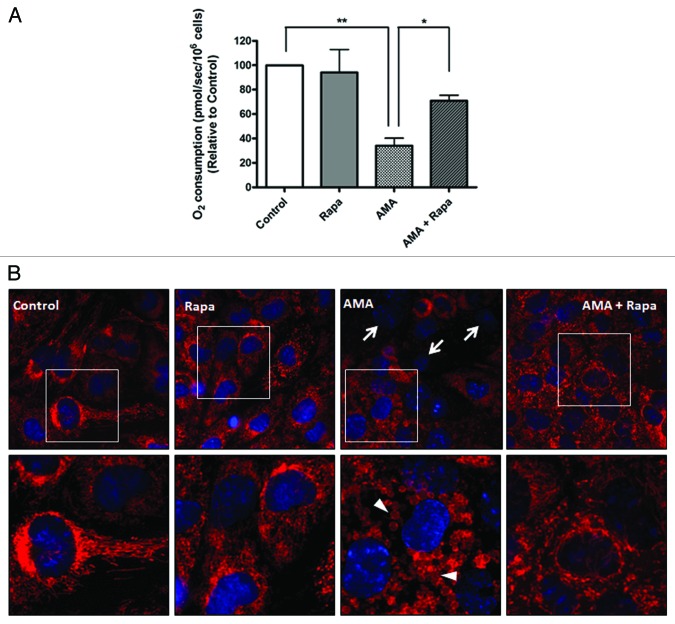
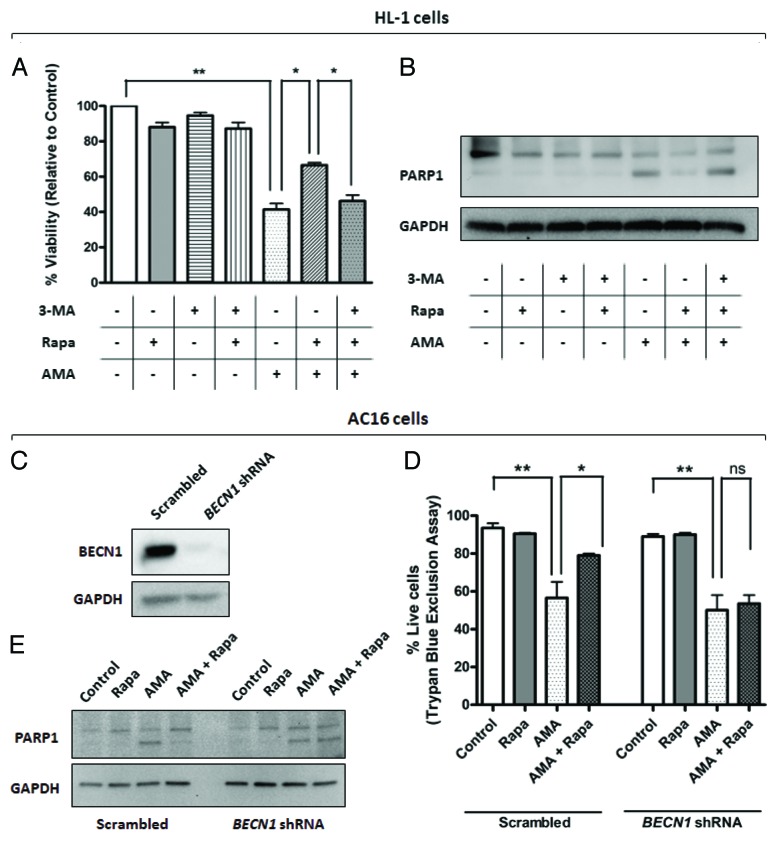
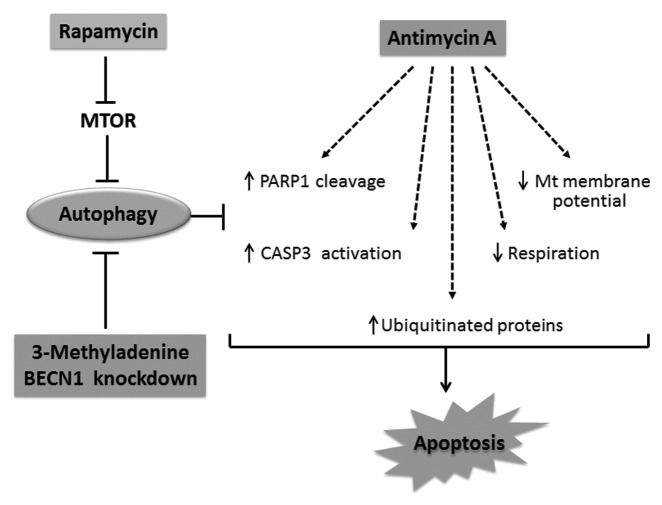
Autophagy is a cellular self-digestion process that mediates protein quality control and serves to protect against neurodegenerative disorders, infections, inflammatory diseases and cancer. Current evidence suggests that autophagy can selectively remove damaged organelles such as the mitochondria. Mitochondria-induced oxidative stress has been shown to play a major role in a wide range of pathologies in several organs, including the heart. Few studies have investigated whether enhanced autophagy can offer protection against mitochondrially-generated oxidative stress. We induced mitochondrial stress in cardiomyocytes using antimycin A (AMA), which increased mitochondrial superoxide generation, decreased mitochondrial membrane potential and depressed cellular respiration. In addition, AMA augmented nuclear DNA oxidation and cell death in cardiomyocytes. Interestingly, although oxidative stress has been proposed to induce autophagy, treatment with AMA did not result in stimulation of autophagy or mitophagy in cardiomyocytes. Our results showed that the MTOR inhibitor rapamycin induced autophagy, promoted mitochondrial clearance and protected cardiomyocytes from the cytotoxic effects of AMA, as assessed by apoptotic marker activation and viability assays in both mouse atrial HL-1 cardiomyocytes and human ventricular AC16 cells. Importantly, rapamycin improved mitochondrial function, as determined by cellular respiration, mitochondrial membrane potential and morphology analysis. Furthermore, autophagy induction by rapamycin suppressed the accumulation of ubiquitinylated proteins induced by AMA. Inhibition of rapamycin-induced autophagy by pharmacological or genetic interventions attenuated the cytoprotective effects of rapamycin against AMA. We propose that rapamycin offers cytoprotection against oxidative stress by a combined approach of removing dysfunctional mitochondria as well as by degrading damaged, ubiquitinated proteins. We conclude that autophagy induction by rapamycin could be utilized as a potential therapeutic strategy against oxidative stress-mediated damage in cardiomyocytes.

Keywords: MTOR; autophagy; cardiomyocytes; mitochondrial dysfunction; oxidative stress; rapamycin.


Figures

None
Figure 1. AMA causes cytotoxicity in HL-1 cardiomyocytes. (A) Cells were trypsinized and resuspended in fresh media followed by staining with 3 µM MitoSOX Red. Cells were subsequently incubated with increasing concentrations of AMA or vehicle control for 30 min followed by flow cytometric analysis of MitoSOX Red fluorescence. (B) Cells were incubated with 1 µg/µl Hoechst 33342 and 3 µM MitoSOX Red and subsequently treated with 50 µM AMA or vehicle control for 30 min, followed by confocal imaging. (C) Cells were trypsinized and resuspended in fresh media followed by staining with 50 nM TMRM and were subsequently incubated with increasing concentrations of AMA or vehicle control for 2 h followed by flow cytometric analysis of TMRM fluorescence. (D) Cells were incubated with 1 µg/ul Hoechst 33342 and 50 nM TMRM and subsequently treated with 50 µM AMA or vehicle control for 2 h, followed by confocal imaging. (E) Cells were incubated with increasing concentrations of AMA for 2 h, and were trypsinized and processed for HPLC analysis of DNA (E) and RNA (F) oxidation 24 h later. Data have been normalized to vehicle-treated control. (G) Cells were incubated with increasing concentrations of AMA and cell viability determined using MTT assay after the indicated time points. Data have been normalized to vehicle-treated control. *p < 0.05; **p < 0.01, ***p < 0.001 vs. control. Data are derived from three independent experiments.
None
Figure 2. Treatment with AMA does not induce autophagy in HL-1 cardiomyocytes. (A) Cells were incubated with increasing concentrations of AMA for 4 h, in the presence of DMSO (vehicle) or 75 nM BafA1. Cells were subsequently lysed and immunoblotted for LC3B. GAPDH is used as a loading control. (B) LC3-II/LC3-I ratios were calculated from three independent experiments as in (A). (C) Autophagic flux in HL-1 cells treated with AMA as in (A) was calculated by subtracting LC3-II/LC3-I ratios under steady-state conditions from that obtained under +BafA1 conditions. Data represents three independent experiments. (D) Cells were transfected with GFP-LC3 plasmid and 24 h after transfection, treated with 50 µM AMA for 4 h, in the presence of DMSO (vehicle) or 75 nM BafA1. Cells were subsequently fixed in 4% paraformaldehyde, stained with DAPI and images taken using epifluoresence microscope. Representative images are shown. (E) The number of GFP-LC3 puncta in each cell for (D) was counted to determine the percentage of cells with stimulated autophagy. (F) Cells were treated with vehicle control or 50 µM AMA for 32 h and were subsequently lysed and immunoblotted for VDAC1. GAPDH is used as a loading control.
None
Figure 3. Treatment with rapamycin induces autophagy in HL-1 cardiomyocytes. (A) Cells were incubated with increasing concentrations of rapamycin for 16 h, in the presence of DMSO (vehicle) or 75 nM BafA1, added during the final 4 h of incubation. Cells were subsequently lysed and immunoblotted for LC3B. TUBB is used as a loading control. (B) LC3-II/LC3-I ratios were calculated from three independent experiments as in (A). (C) Autophagic flux in rapamycin-treated cells were calculated by subtracting LC3-II/LC3-I ratios under steady-state conditions from that obtained under +BafA1 conditions. (D) Cells were transfected with GFP-LC3 plasmid and 24 h after transfection, treated with 1 µM rapamycin for 16 h, in the presence of DMSO (vehicle) or 75 nM BafA1, added during the final 4 h of incubation. Cells were subsequently fixed in 4% paraformaldehyde, stained with DAPI and images taken using epifluoresence microscope. Representative images are shown. (E) The number of GFP-LC3 puncta in each cell for (D) was counted to determine the percentage of cells with stimulated autophagy. (F) Cells were treated with vehicle control or 1 µM rapamycin for 48 h. Cell lysates were collected and immunoblotted for SQSTM1 or VDAC1. GAPDH is used as a loading control. Rapa, rapamycin. *p < 0.05, ***p < 0.001 vs. control. Data are derived from two to three independent experiments.
None
Figure 4. Rapamycin induces autophagy in the presence of AMA in HL-1 cardiomyocytes. (A) Cells were treated with AMA alone or rapamycin plus AMA for 16 h in the presence of DMSO (vehicle) or 75 nM BafA1, added during the final 4 h of incubation. Cells were subsequently lysed and immunoblotted for LC3B. GAPDH is used as a loading control. (B) Cells were treated with vehicle control, AMA or AMA plus rapamycin for 32 h and were subsequently lysed and immunoblotted for SQSTM1. GAPDH is used as a loading control. (C) Cells were transfected with GFP-LC3 plasmid and 24 h after transfection, treated with 1 µM rapamycin or vehicle control for 16 h. Cells were then incubated with 50 nM TMRM for 30 min, followed by treatment with 50 μM AMA. Cells were subsequently imaged using confocal microscopy. Higher magnification images of the boxed areas are shown in the bottom-panels. Arrow indicates mitochondria surrounded by a growing autophagic vacuole. Rapa, rapamycin.
None
Figure 5A–C. Rapamycin protects against the cytotoxic effects of AMA in HL-1 and AC16 cardiomyocytes. (A and B) HL-1 cells were pre-treated with vehicle control or 1 µM rapamycin for 16 h, followed by incubation with 50 µM AMA for an additional 32 h, in the absence or presence of rapamycin. Cell viability was subsequently assessed using trypan blue exclusion assay (A) or cell lysates were collected and immunoblotted for PARP1 (B). GAPDH is used as a loading control. (C). HL-1 cells were pretreated with vehicle control or 1 µM rapamycin for 16 h, followed by incubation with 50 µM AMA for an additional 24 h, in the absence or presence of rapamycin. Phase contrast images of cells were subsequently taken. Representative images are shown.
None
Figure 5D–F. (D and E) AC16 cells were treated with rapamycin or AMA alone or were coincubated with AMA and rapamycin for 48 h. Cell viability was subsequently assessed using trypan blue exclusion assay (D) or cell lysates were collected and immunoblotted for PARP1 (E). (F) AC16 cells were treated with rapamycin or AMA alone or were coincubated with AMA and rapamycin for 36 h. Phase contrast images of cells were subsequently taken. Representative images are shown. Rapa, rapamycin. *p < 0.05; **p < 0.01 vs. control (for A, previous page, and D). Data represent three independent experiments.
None
Figure 6. Rapamycin protects against AMA-induced mitochondrial depolarization and respiration dysfunction in HL-1 cardiomyocytes. (A) Cells were pretreated with vehicle control or 1 µM rapamycin for 16 h, followed by treatment with 50 µM AMA for an additional 24 h, in the absence or presence of rapamycin. Cells were subsequently trypsinized, resuspended in Claycomb media and routine respiration analyzed. Data are derived from three independent experiments. *p < 0.05; **p < 0.01. (B) Cells were pretreated with vehicle control or 1 µM rapamycin for 16 h, followed by incubation with 50 µM AMA for an additional 24 h, in the absence or presence of rapamycin. Cells were subsequently stained with 50 nM TMRM and imaged using epifluorescence microscope. Representative images are shown. Arrows represent cells with no Δψm. Arrowheads represent swollen mitochondria. Rapa; rapamycin.
None
Figure 7. Inhibition of autophagy attenuates rapamycin-mediated protection against AMA toxicity in HL-1 and AC16 cardiomyocytes. (A) HL-1 cells were pre-treated with vehicle control or 1 µM rapamycin in the absence or presence of 5 mM 3-MA for 16 h, followed by treatment with 50 µM AMA for an additional 32 h, in the presence of rapamycin and 5mM 3-MA. Cell viability was subsequently assessed using MTT assay. *p < 0.05; **p < 0.01. Data represent three independent experiments. (B) HL-1 cells were treated as in (B), cell lysates collected and immunoblotted for PARP1. GAPDH is used as a loading control. (C) AC16 cells were transduced with a lentiviral vector expressing scrambled or BECN1 shRNA. Cells were subsequently lysed and immunoblotted for BECN1 protein expression. GAPDH is used as a loading control. (D) Scrambled or BECN1 shRNA-expressing cells were treated with AMA alone or were coincubated with rapamycin for 48 h. Cell viability was subsequently assessed using trypan blue exclusion assay. *p < 0.05; **p < 0.01.Data represent three independent experiments. (E) AC16 cells were treated as in (D), cell lysates collected and immunoblotted for PARP1. GAPDH is used as a loading control.
None
Figure 8. Schematic representation of the protective effects of rapamycin against AMA toxicity. AMA induces PARP1 cleavage and CASP3 activation, decreases respiration, mitochondrial membrane potential as well as mediates the accumulation of ubiquitinated proteins, all of which culminates in apoptotic induction. Rapamycin treatment induces autophagy by removing the inhibitory effect of MTOR on autophagy induction. Stimulation of autophagy suppresses cytotoxic markers induced by AMA. On the other hand, inhibition of rapamycin-induced autophagy by pharmacological (3-MA) or genetic (shRNA) interventions blocks the cytoprotective effects of rapamycin.

References

    1. Balaban RS, Nemoto S, Finkel T. Mitochondria, oxidants, and aging. Cell. 2005;120:483–95. doi: 10.1016/j.cell.2005.02.001. - DOI - PubMed
    1. Judge S, Jang YM, Smith A, Hagen T, Leeuwenburgh C. Age-associated increases in oxidative stress and antioxidant enzyme activities in cardiac interfibrillar mitochondria: implications for the mitochondrial theory of aging. FASEB J. 2005;19:419–21. - PubMed
    1. Grivennikova VG, Kareyeva AV, Vinogradov AD. What are the sources of hydrogen peroxide production by heart mitochondria? Biochim Biophys Acta. 2010;1797:939–44. doi: 10.1016/j.bbabio.2010.02.013. - DOI - PMC - PubMed
    1. Starkov AA. The role of mitochondria in reactive oxygen species metabolism and signaling. Ann N Y Acad Sci. 2008;1147:37–52. doi: 10.1196/annals.1427.015. - DOI - PMC - PubMed
    1. Brand MD. The sites and topology of mitochondrial superoxide production. Exp Gerontol. 2010;45:466–72. doi: 10.1016/j.exger.2010.01.003. - DOI - PMC - PubMed

Publication types