

Characterization of stapes anatomy: investigation of human and guinea pig
- PMID: 23299488
- PMCID: PMC3660917
- DOI: 10.1007/s10162-012-0369-5
Characterization of stapes anatomy: investigation of human and guinea pig
Abstract
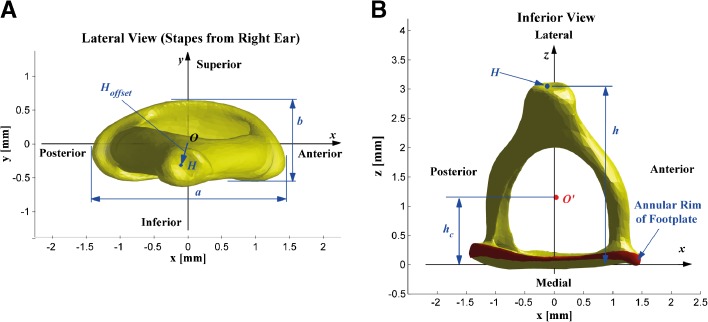
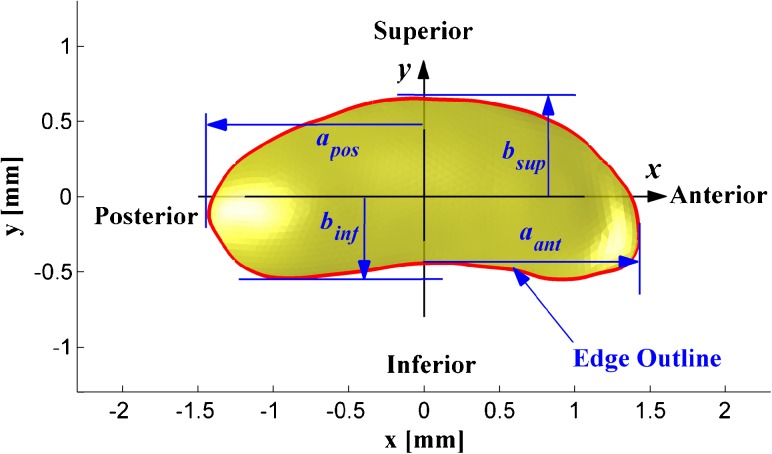
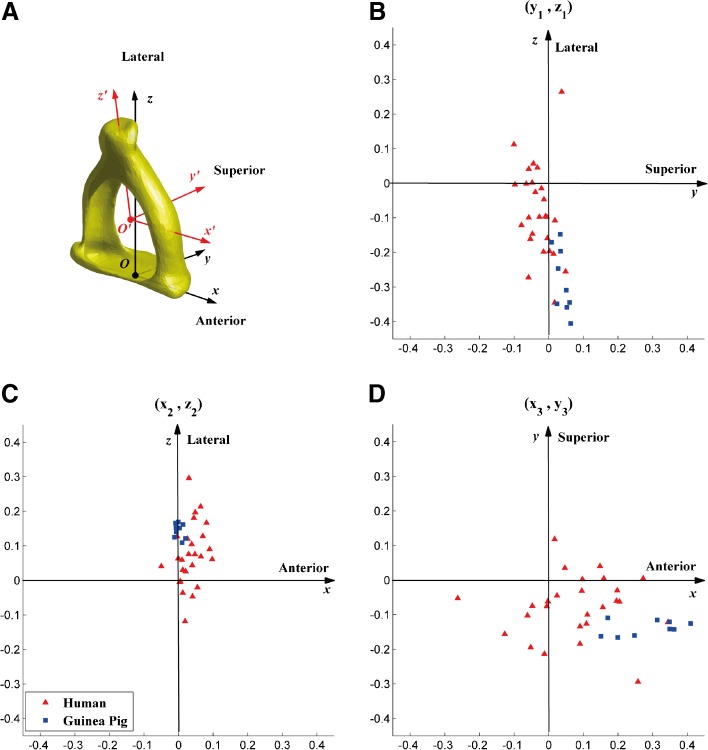
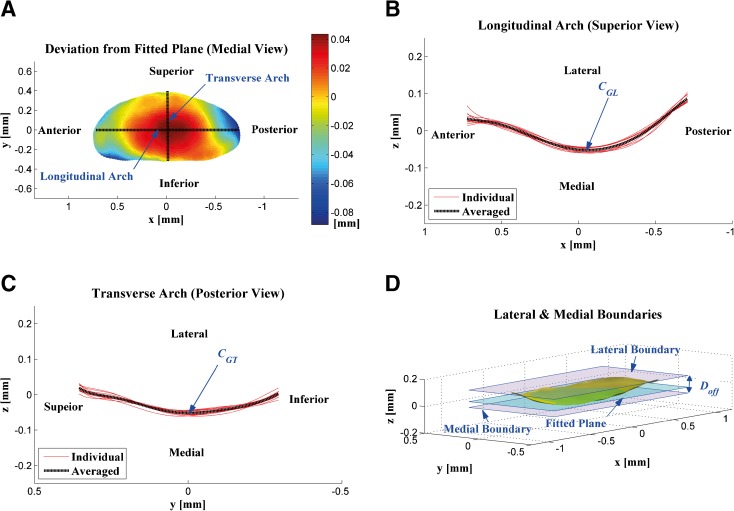
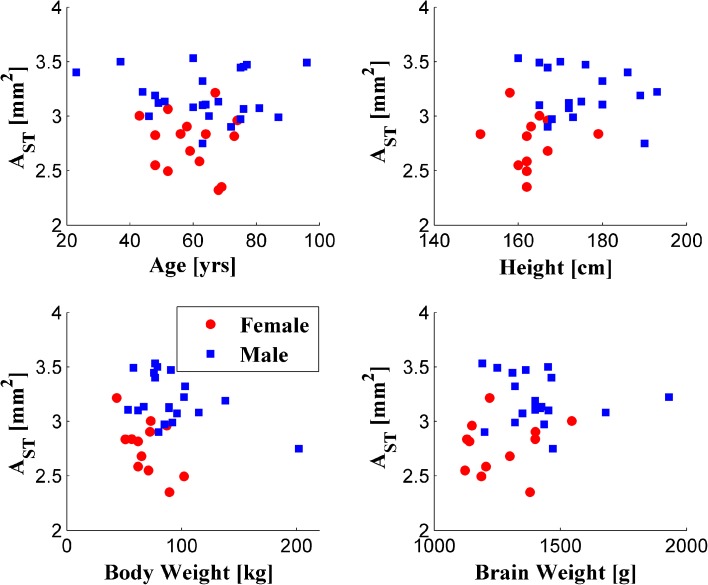
The accuracy of any stapes model relies on the accuracy of the anatomical information upon which it is based. In many previous models and measurements of the stapes, the shape of the stapes has been considered as symmetric with respect to the long and short axes of the footplate. Therefore, the reference frame has been built based upon this assumption. This study aimed to provide detailed anatomical information on the dimensions of the stapes, including its asymmetries. High-resolution microcomputed tomography data from 53 human stapes and 11 guinea pig stapes were collected, and their anatomical features were analyzed. Global dimensions of the stapes, such as the size of the footplate, height, and volume, were compared between human and guinea pig specimens, and asymmetric features of the stapes were quantitatively examined. Further, dependence of the stapes dimensions on demographic characteristics of the subjects was explored. The height of the stapes relative to the footplate size in the human stapes was found to be larger than the corresponding value in guinea pig. The stapes showed asymmetry of the footplate with respect to the long axis and offset of the stapes head from the centroid of the medial surface of the footplate for both humans and guinea pigs. The medial surface of the footplate was curved, and the longitudinal arches of the medial surface along the long axis of the footplate were shaped differently between humans and guinea pigs. The dimension of the footplate was gender-dependent, with the size greater in men than in women.
Figures


Similar articles
-
Anatomy and anthropometry of human stapes.Am J Otolaryngol. 2008 Jan-Feb;29(1):42-7. doi: 10.1016/j.amjoto.2007.01.004. Am J Otolaryngol. 2008. PMID: 18061831
-
Measurement of stapes footplate thickness in otosclerosis by ultra-high-resolution computed tomography.Acta Otolaryngol. 2020 Nov;140(11):899-903. doi: 10.1080/00016489.2020.1788225. Epub 2020 Jul 23. Acta Otolaryngol. 2020. PMID: 32700991
-
High-resolution X-ray computed tomographic scanning of the human stapes footplate.J Otolaryngol. 2004 Aug;33(4):217-21. doi: 10.2310/7070.2004.03075. J Otolaryngol. 2004. PMID: 15903201
-
Microcomputed tomography of the stapes: Wide-ranging dimensions.Ear Nose Throat J. 2018 Apr-May;97(4-5):116-121. Ear Nose Throat J. 2018. PMID: 29940679
-
Laser-assisted endoscopic stapedectomy: a prospective study.Laryngoscope. 2000 May;110(5 Pt 2 Suppl 95):1-37. doi: 10.1097/00005537-200005001-00001. Laryngoscope. 2000. PMID: 10807349 Review.
Cited by
-
Local Drug Delivery to the Entire Cochlea without Breaching Its Boundaries.iScience. 2020 Mar 27;23(3):100945. doi: 10.1016/j.isci.2020.100945. Epub 2020 Feb 26. iScience. 2020. PMID: 32151971 Free PMC article.
-
How the Human Cochlea Moves: Biomechanical Modeling of a Wide, Layered Osseous Spiral Lamina.J Assoc Res Otolaryngol. 2025 Jul 9. doi: 10.1007/s10162-025-01000-4. Online ahead of print. J Assoc Res Otolaryngol. 2025. PMID: 40634798
-
Morphological, Histological and Morphometrical Aspects of Auditory Ossicles in Pig Fetuses (Sus scrofa domestica).Animals (Basel). 2025 Apr 14;15(8):1129. doi: 10.3390/ani15081129. Animals (Basel). 2025. PMID: 40281963 Free PMC article.
-
Computational model of the human cochlea with motion of the layered osseous spiral lamina.bioRxiv [Preprint]. 2024 Aug 19:2024.08.16.608342. doi: 10.1101/2024.08.16.608342. bioRxiv. 2024. Update in: J Assoc Res Otolaryngol. 2025 Jul 9. doi: 10.1007/s10162-025-01000-4. PMID: 39229101 Free PMC article. Updated. Preprint.
-
Anatomic variability of oval window as pertaining to stapes surgery.Surg Radiol Anat. 2020 Mar;42(3):329-335. doi: 10.1007/s00276-019-02347-z. Epub 2019 Sep 23. Surg Radiol Anat. 2020. PMID: 31549199
References
-
- Arensburg B, Harell M, Nathan H. The human middle ear ossicles, morphometry and taxonomic implications. J Hum Evol. 1981;10:199–205. doi: 10.1016/S0047-2484(81)80018-8. - DOI
-
- ÀWengen DF, Kurokawa H, Nishihara S, Goode RL. Measurements of the stapes superstructure. Ann Otol Rhinol Laryngol. 1995;104:311–316. - PubMed
-
- Bouchet A, Giraud M. Contribution a l’etude morphologique et radiologique des osselets de l’ouie. Compte rendu de l’ Association des Anatomists 53 Congrés. 1968;141:588–600.
Publication types
MeSH terms
LinkOut - more resources
Full Text Sources
Other Literature Sources
