

Toward rigorous idiographic research in prevention science: comparison between three analytic strategies for testing preventive intervention in very small samples
- PMID: 23299558
- PMCID: PMC3782303
- DOI: 10.1007/s11121-012-0311-4
Toward rigorous idiographic research in prevention science: comparison between three analytic strategies for testing preventive intervention in very small samples
Abstract
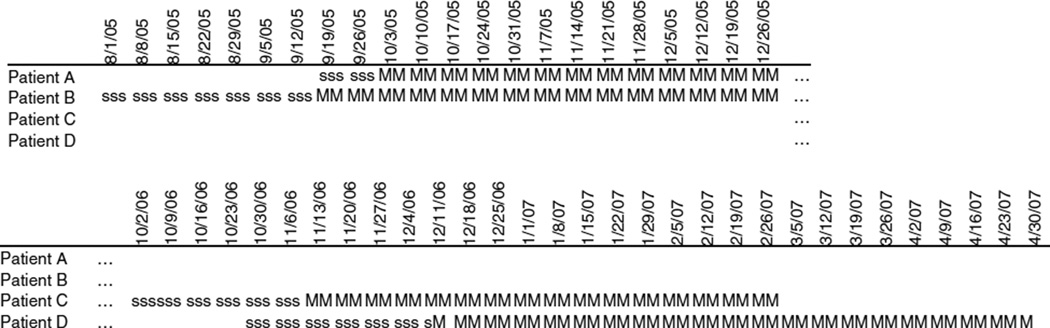
Psychosocial prevention research lacks evidence from intensive within-person lines of research to understand idiographic processes related to development and response to intervention. Such data could be used to fill gaps in the literature and expand the study design options for prevention researchers, including lower-cost yet rigorous studies (e.g., for program evaluations), pilot studies, designs to test programs for low prevalence outcomes, selective/indicated/adaptive intervention research, and understanding of differential response to programs. This study compared three competing analytic strategies designed for this type of research: autoregressive moving average, mixed model trajectory analysis, and P-technique. Illustrative time series data were from a pilot study of an intervention for nursing home residents with diabetes (N = 4) designed to improve control of blood glucose. A within-person, intermittent baseline design was used. Intervention effects were detected using each strategy for the aggregated sample and for individual patients. The P-technique model most closely replicated observed glucose levels. ARIMA and P-technique models were most similar in terms of estimated intervention effects and modeled glucose levels. However, ARIMA and P-technique also were more sensitive to missing data, outliers and number of observations. Statistical testing suggested that results generalize both to other persons as well as to idiographic, longitudinal processes. This study demonstrated the potential contributions of idiographic research in prevention science as well as the need for simulation studies to delineate the research circumstances when each analytic approach is optimal for deriving the correct parameter estimates.
Figures

References
-
- Biglan A, Ary D, Koehn V, Levings D. Mobilizing positive reinforcement in communities to reduce youth access to tobacco. American Journal of Community Psychology. 1996;24:625–638. - PubMed
-
- Bolderman KM. Putting your patients on the pump. Alexandria, VA: American Diabetes Association, Inc; 2002. pp. 39–52.
-
- Borkenau P, Ostendorf F. The Big Five as states: How useful is the five-factor model to describe intraindividual variations over time? Journal of Research in Personality. 1998;32:202–221.
Publication types
MeSH terms
Grants and funding
LinkOut - more resources
Full Text Sources
Other Literature Sources
