. 2013 Mar 1;288(9):6451-64.
doi: 10.1074/jbc.M112.421495. Epub 2013 Jan 8.

Intracellular trafficking of the KV1.3 potassium channel is regulated by the prodomain of a matrix metalloprotease

Affiliations

Intracellular trafficking of the KV1.3 potassium channel is regulated by the prodomain of a matrix metalloprotease

Hai M Nguyen et al. J Biol Chem. .

Abstract

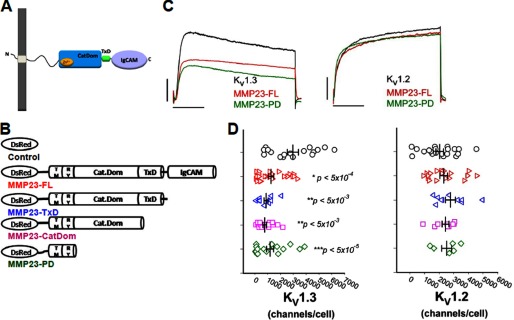
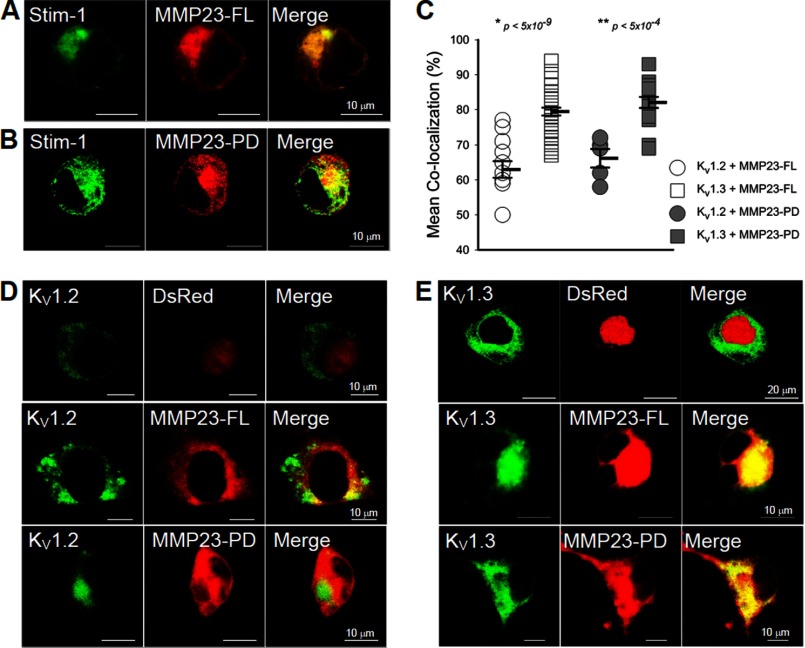
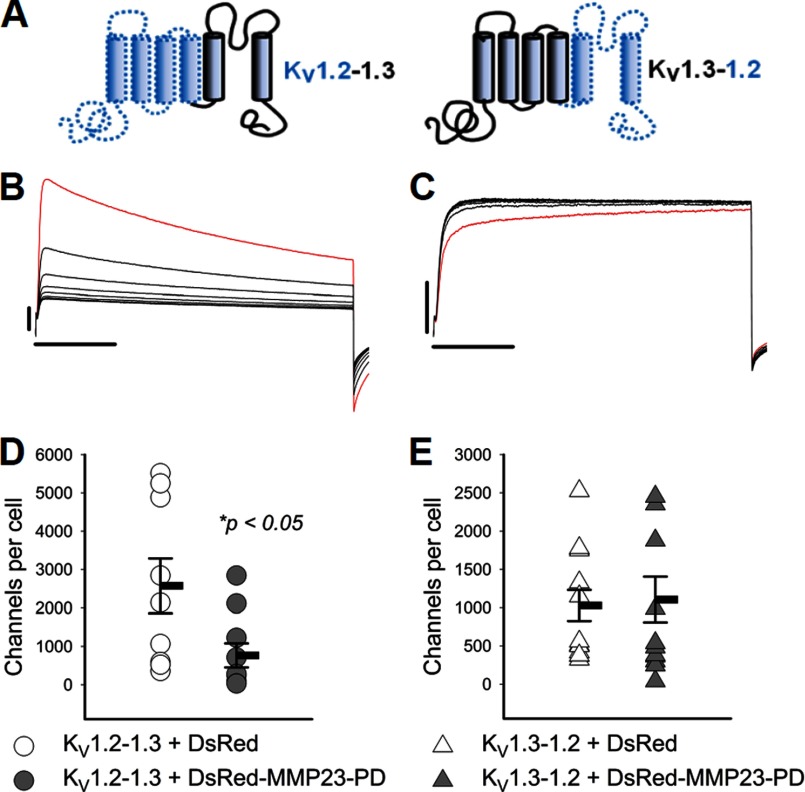
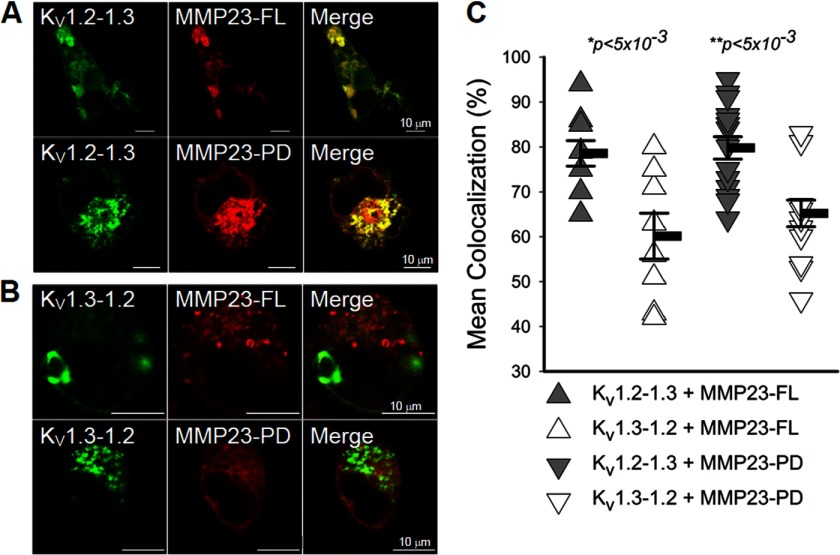
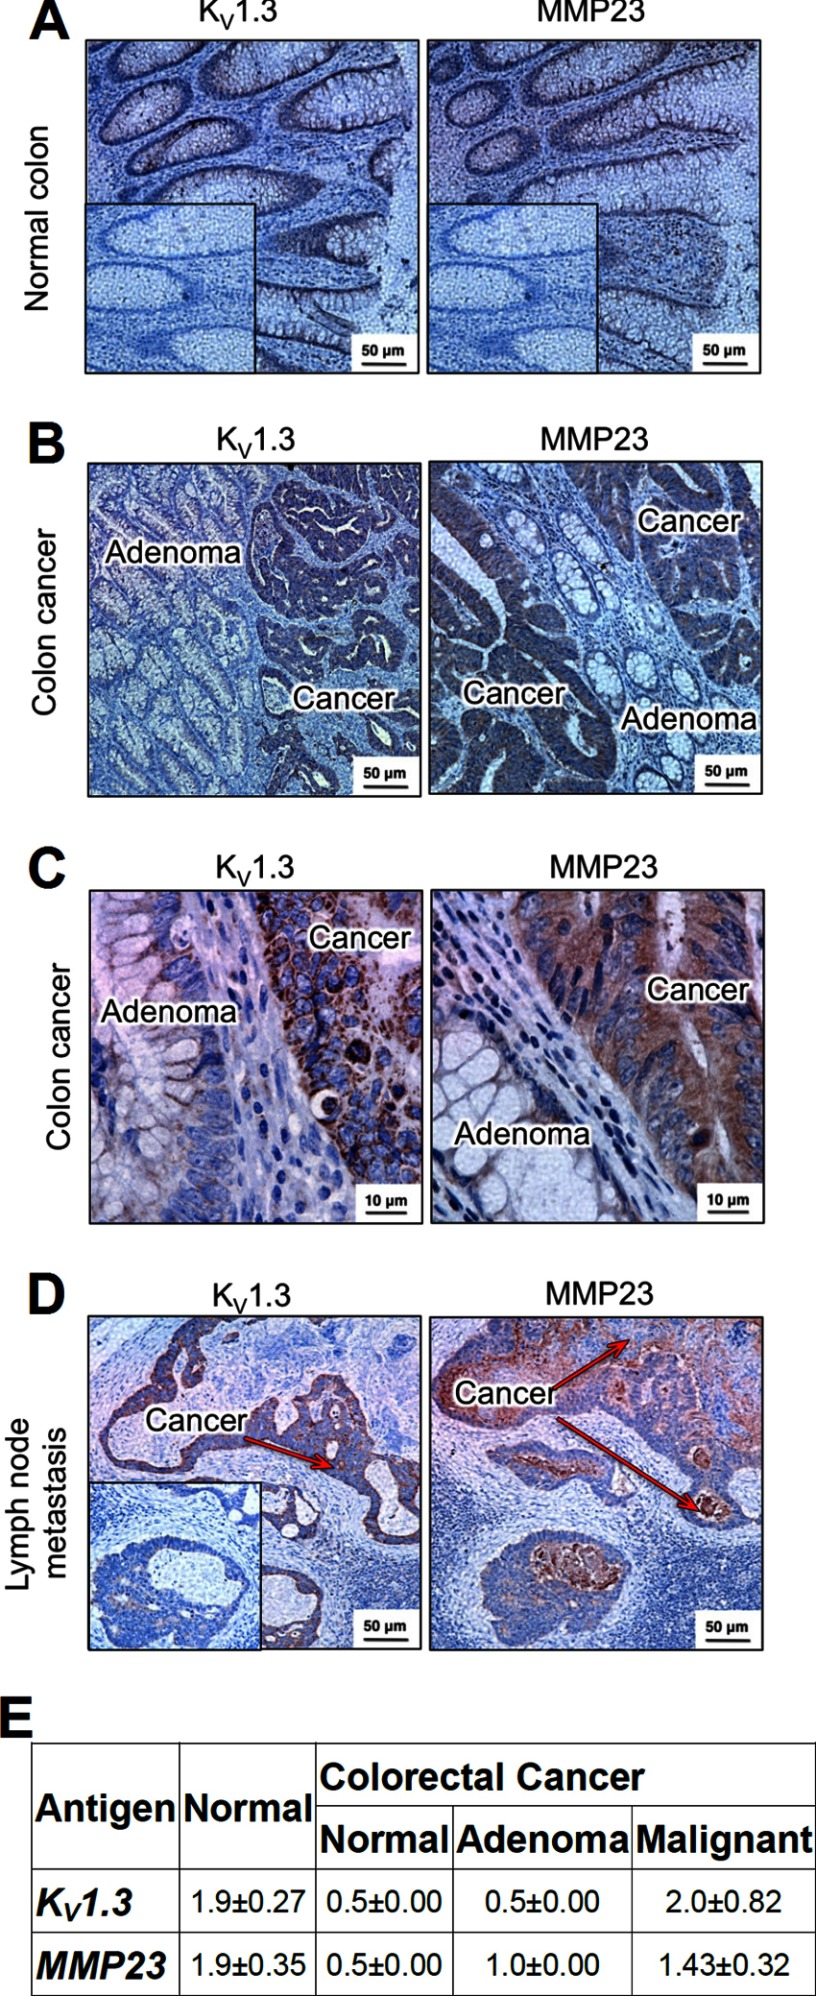
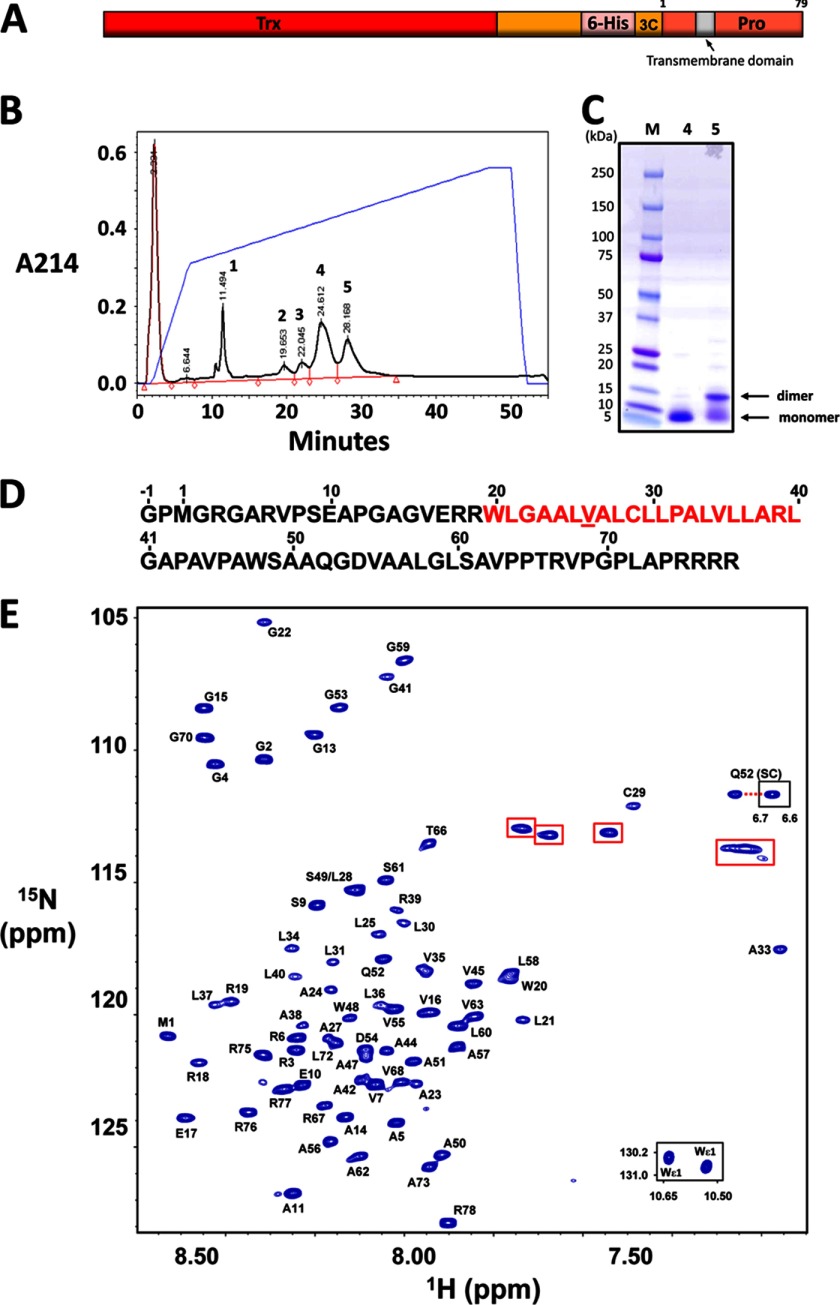
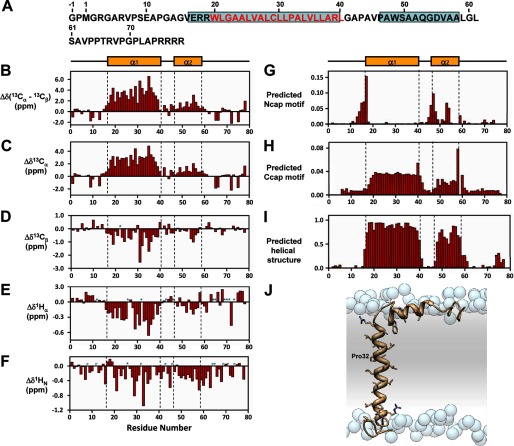
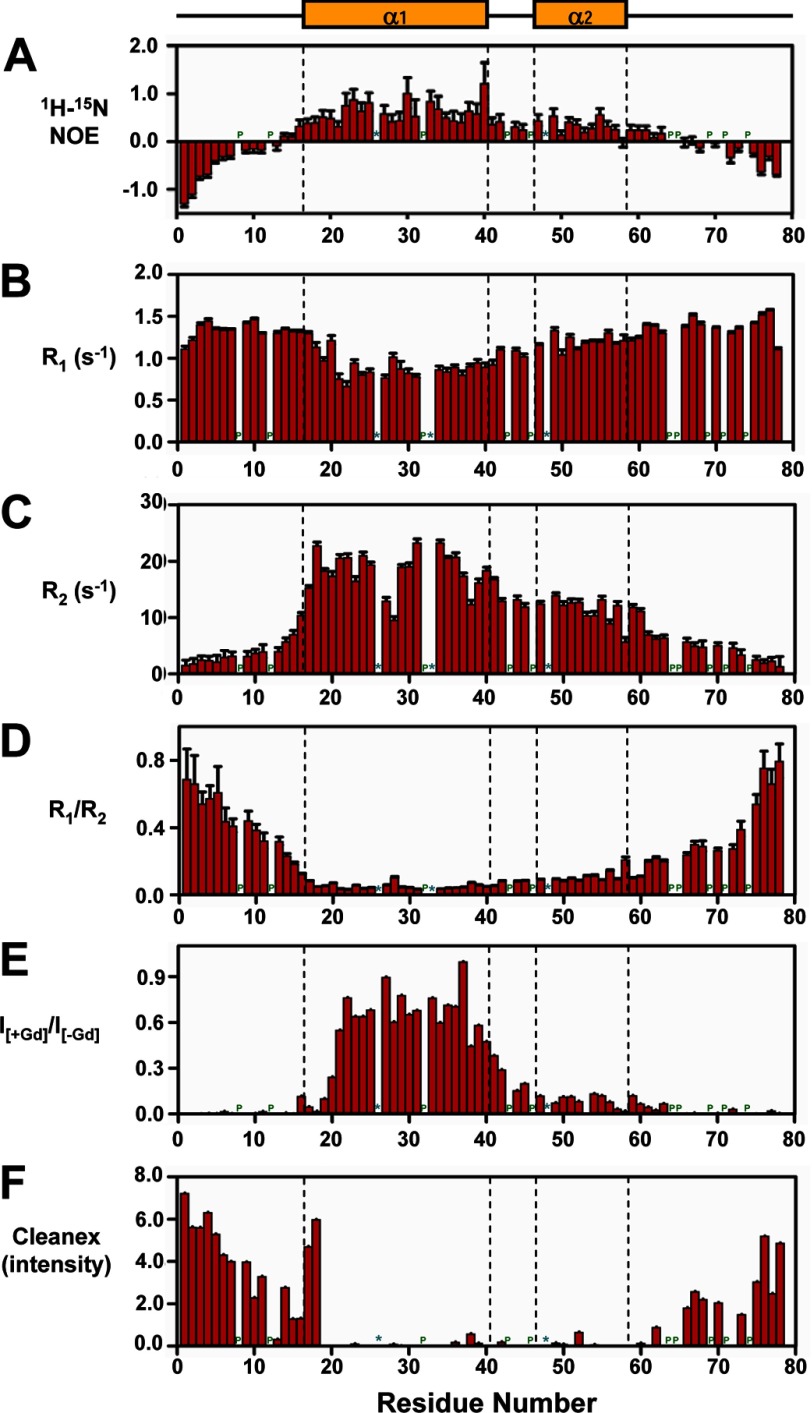
Matrix metalloproteases (MMPs) are endopeptidases that regulate diverse biological processes. Synthesized as zymogens, MMPs become active after removal of their prodomains. Much is known about the metalloprotease activity of these enzymes, but noncanonical functions are poorly defined, and functions of the prodomains have been largely ignored. Here we report a novel metalloprotease-independent, channel-modulating function for the prodomain of MMP23 (MMP23-PD). Whole-cell patch clamping and confocal microscopy, coupled with deletion analysis, demonstrate that MMP23-PD suppresses the voltage-gated potassium channel KV1.3, but not the closely related KV1.2 channel, by trapping the channel intracellularly. Studies with KV1.2-1.3 chimeras suggest that MMP23-PD requires the presence of the KV1.3 region from the S5 trans-membrane segment to the C terminus to modulate KV1.3 channel function. NMR studies of MMP23-PD reveal a single, kinked trans-membrane α-helix, joined by a short linker to a juxtamembrane α-helix, which is associated with the surface of the membrane and protected from exchange with the solvent. The topological similarity of MMP23-PD to KCNE1, KCNE2, and KCNE4 proteins that trap KV1.3, KV1.4, KV3.3, and KV3.4 channels early in the secretory pathway suggests a shared mechanism of channel regulation. MMP23 and KV1.3 expression is enhanced and overlapping in colorectal cancers where the interaction of the two proteins could affect cell function.


Figures

FIGURE 1.
FIGURE 1.
MMP23-PD suppresses KV1.3 but not KV1.2 currents. A, schematic of full-length MMP23 (MMP23-FL) showing its functional domains. B, schematic of DsRed-tagged MMP23-FL and C-terminal deletion constructs. CatDom, catalytic domain. C, KV1.3 and KV1.2 currents in the presence or absence of MMP23-FL (red) and MMP23-PD (green). Scale bars represent 1 nA and 50 ms, respectively. D, scattergrams showing channel numbers/cell of KV1.3 and KV1.2 channels in the presence or absence of MMP23-FL or deletion constructs. Means are determined from n samples of 8–38 for KV1.3 and 6–17 for KV1.2, respectively. Error bars indicate S.E. The membrane capacitances of the patched cells were 15.1 ± 1.0 pF (cells co-expressing the DsRed vector), 15.4 ± 1.1 pF (cells co-expressing DsRed-MMP23-FL), and 18.36 ± 1.6 pF (cells co-expressing DsRed-MMP23-PD). Statistical significance is determined by Student's t test and indicated by p values.
FIGURE 2.
FIGURE 2.
Co-localization of MMP23 with KV1.3 but not KV1.2. A and B, confocal microscopy demonstrating that MMP23-FL and MMP23-PD co-localize with YFP-Stim-1, an ER marker. YFP-Stim-1: pseudocolor green was used for the presentation. C, quantification of co-localization of MMP23-FL and MMP23-PD with KV1.3 and KV1.2. Means are determined from n samples of 10–35 for KV1.3 and 6–14 for KV1.2, respectively. Error bars indicate S.E. Statistical significance is determined by Student's t test and indicated by p values. D and E, confocal images showing that DsRed-MMP23-FL and DsRed-MMP23-PD co-localize with KV1.3-GFP but not with KV1.2-GFP, whereas the DsRed vector does not co-localize with either channel.
FIGURE 3.
FIGURE 3.
MMP23-PD suppresses activity of the KV1.2-KV1.3 chimera but not the KV1.3-KV1.3 chimera. A, diagram showing the construction of the KV1.2-1.3 and the KV1.3-1.2 chimeras from domains of their respective KV1.2 and KV1.3 parental channels. B, the KV1.2-KV1.3 chimera containing the KV1.3 pore domain exhibits cumulative inactivation, a unique property of the Kv1.3 pore domain. C, the KV1.3-KV1.2 chimera containing the KV1.2 pore domain exhibits use-dependent potentiation, a unique property of the KV1.2 channel pore domain. Red traces represent the first traces of the currents elicited by pulses to +40 mV in 1-s intervals, and black traces represent subsequent current thereafter. Scale bars indicate 1 nA and 100 ms, respectively. D and E, scattergrams showing channel numbers/cell in cells expressing the KV1.2-1.3 and KV1.3-1.2 chimeras in the presence of DsRed vector or DsRed-MMP23-PD. Means are determined from n samples of 9–13. Error bars indicate S.E. Membrane capacitances of the patched cells were 17.1 ± 0.9 pF (cells co-expressing KV1.2-1.3 + the DsRed vector), 15.3 ± 0.5 pF (cells co-expressing KV1.2-1.3 + DsRed-MMP23-PD), 18.0 ± 1.1 pF (cells co-expressing KV1.3-1.2 + the DsRed vector), and 15.6 ± 0.8 pF (cells co-expressing KV1.3-1.3 + DsRed-MMP23-PD). Statistical significance is determined by Student's t test and indicated by p values.
FIGURE 4.
FIGURE 4.
MMP23-PD co-localizes with the KV1.2-1.3 but not the KV1.3-1.2 chimera. A and B, confocal microscopic images showing that DsRed-MMP23-FL and DsRed-MMP23-PD co-localize with the GFP-KV1.2-1.3 chimera but not the GFP-KV1.3-1.2 chimera. C, quantification of co-localization of DsRed-MMP23-FL and MMP23-PD with GFP-KV1.2-1.3 versus GFP-KV1.3-1.2. Means are determined from n samples of 9–17. Error bars indicate S.E. Statistical significance is determined by Student's t test and indicated by p values.
FIGURE 5.
FIGURE 5.
Expression of KV1.3 and MMP23 in human colon. A, immunohistochemistry of normal human colon (at 20×) showing KV1.3 (left) and MMP23 (right) in epithelial cells. Inset, the same isotype control was used for both KV1.3 and MMP23; polyclonal rabbit IgG was used in place of the primary rabbit anti-KV1.3 or rabbit anti-MMP23 antibodies. B, KV1.3 (left, 20×) and MMP23 (right, 20×) expression in colorectal cancer. Arrows indicate adenoma (yellow) and KV1.3- and MMP23-expressing malignant colorectal epithelium (red). C, higher magnification images of colorectal cancer showing KV1.3 (left, 100×) and MMP23 (right, 100×). Note intracellular staining of both proteins. D, KV1.3 (left, 20×) and MMP23 (right, 20×) in metastatic colorectal epithelium in lymph nodes. The red arrows highlight the KV1.3- and MMP23-expressing metastatic colorectal epithelium. The surrounding lymph node is not stained. E, scoring of staining intensity on a scale of 1–3 of KV1.3 and MMP23 in epithelium from normal colon and from three regions of colonic tissue from patients with colorectal cancer: normal-looking crypts, adenoma, and malignant epithelium.
FIGURE 6.
FIGURE 6.
Purification and backbone resonance assignments for MMP23-PD. A, MMP23-PD construct used for these studies. Trx, thioredoxin; 6-His, hexahistidine tag; 3C, 3C protease cleavage site; Pro, MMP23 prodomain. B, reverse-phase HPLC purification of MMP23-PD. The monomeric and dimeric forms of MMP23-PD eluted in fractions 4 and 5, respectively. C, SDS-PAGE analysis of purified MMP23-PD. Reverse-phase HPLC fraction numbers are shown in lanes 1 and 2, respectively. D, amino acid sequence of MMP23-PD with the predicted TMD highlighted in red. Spectral overlap prevented assignment of Val-26 (underlined). The sequence includes the N-terminal residual tag residues Gly-1 and Pro-0. E, 1H-15N HSQC spectrum of uniformly 13C-15N-labeled MMP23-PD in 20 mm sodium citrate buffer, pH 5.0, containing 100 mm DPC, 20 mm TCEP, 10% 2H2O, 90% H2O, and 0.02% w/v NaN3 at a final protein concentration of 0.7 mm. Inset: Trp indole NH cross-peaks (bottom right) and one of the Gln-52 side chain resonances (center right). Aliased resonances from the nine Arg side chains are highlighted with red boxes.
FIGURE 7.
FIGURE 7.
Secondary structure of MMP23-PD. A, amino acid sequence of MMP23-PD where α-helical regions are boxed in cyan and residues in the predicted trans-membrane domain are colored red. B–F, deviations of 13Cα-13Cβ (B), 13Cα(C), 13Cβ (D), 1Hα (E), and 1HN (F) chemical shifts from random coil values (56). Sites for which no values were determined are denoted by a P for proline residues or an asterisk for unassigned. Secondary structure elements derived from CSI values are illustrated at the top and boxed by a dotted line in each figure. Helix α1 extends from residue Glu-17 to Leu-40 and helix α2 from residue Ala-47 to Leu-58. G and H, prediction of N-terminal (G) (Ncap) and C-terminal (H) helical capping (Ccap) motifs using the MICS algorithm. I, helical regions for MMP23-PD determined by MICS (34). MICS is similar to TALOS+ (33), which uses an artificial neural network to predict protein ϕ and ψ backbone torsion angles and protein secondary structure for a given residue along with its two flanking residues using a combination of six kinds of chemical shifts (HN, HA, CA, CB, CO, N) and the amino acid sequence. On the other hand, MICS uses an artificial neural network trained to recognize additional structural features such as N- and C-terminal helical capping motifs and the most common types of β-turns for a given residue (i) within a hexapeptide spanning residues i - 1 to 1 + 4. J, model of MMP23-PD in a lipid membrane. Shown is a model of TMD (α1 helix) and juxtamembrane (α2) helix of MMP23-PD in a lipid membrane. Atoms of the side chain groups of residues in the two helices are highlighted. Phosphate groups of the lipid are represented as blue spheres; lipid choline, glycerol and acyl chains, and water are omitted for clarity.
FIGURE 8.
FIGURE 8.
NMR relaxation parameters and membrane topology of MMP23-PD in DPC micelles at 30 °C and 600 MHz. A–D, 1H-15N steady-state NOE values (A), longitudinal (R1) (B), transverse (R2) 15N relaxation rates (C), and ratio of R1 to R2 for MMP23-PD (D). E, ratio of peak intensities before and after the addition of the water-soluble paramagnetic spin label Gd(DTPA-BMA) (19). F, peak intensities for the Clean SEA-HSQC spectrum (Cleanex) (18) of MMP23-PD in DPC micelles, measuring the exchange of backbone amide protons with solvent. Sites for which no values were determined are denoted by a P for proline residues or an asterisk for unassigned residues. Secondary structure elements derived from CSI values are illustrated at the top and boxed by a dotted line in each figure.

Similar articles

Cited by

References

    1. Mannello F., Medda V. (2012) Nuclear localization of matrix metalloproteinases. Prog. Histochem. Cytochem. 47, 27–58 - PubMed
    1. Nagase H., Visse R., Murphy G. (2006) Structure and function of matrix metalloproteinases and TIMPs. Cardiovasc. Res. 69, 562–573 - PubMed
    1. Page-McCaw A., Ewald A. J., Werb Z. (2007) Matrix metalloproteinases and the regulation of tissue remodelling. Nat. Rev. Mol. Cell Biol. 8, 221–233 - PMC - PubMed
    1. Golubkov V. S., Chernov A. V., Strongin A. Y. (2011) Intradomain cleavage of inhibitory prodomain is essential to protumorigenic function of membrane type-1 matrix metalloproteinase (MT1-MMP) in vivo. J. Biol. Chem. 286, 34215–34223 - PMC - PubMed
    1. Jozic D., Bourenkov G., Lim N. H., Visse R., Nagase H., Bode W., Maskos K. (2005) X-ray structure of human proMMP-1: new insights into procollagenase activation and collagen binding. J. Biol. Chem. 280, 9578–9585 - PubMed

Publication types

MeSH terms