. 2013 Mar 1;288(9):6178-89.
doi: 10.1074/jbc.M112.435909. Epub 2013 Jan 8.

Identification of propofol binding sites in a nicotinic acetylcholine receptor with a photoreactive propofol analog

Affiliations

Identification of propofol binding sites in a nicotinic acetylcholine receptor with a photoreactive propofol analog

Selwyn S Jayakar et al. J Biol Chem. .

Abstract

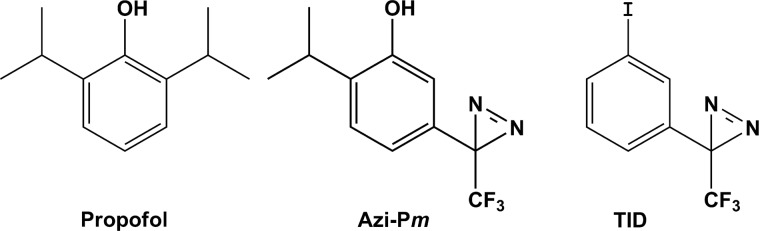
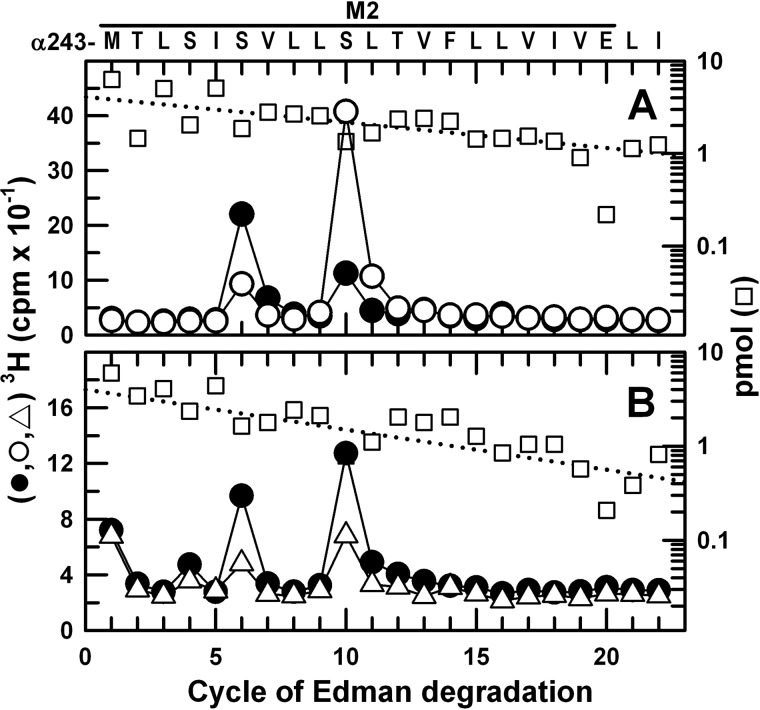
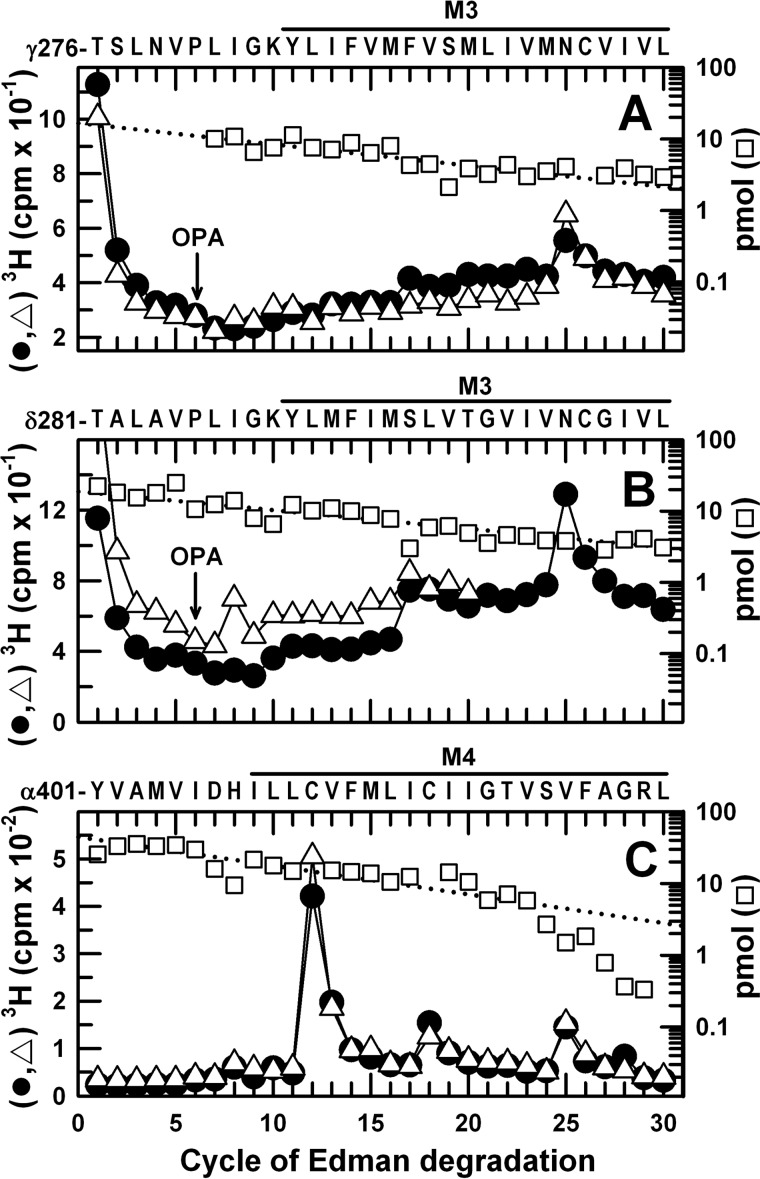
Propofol, a widely used intravenous general anesthetic, acts at anesthetic concentrations as a positive allosteric modulator of γ-aminobutyric acid type A receptors and at higher concentration as an inhibitor of nicotinic acetylcholine receptors (nAChRs). Here, we characterize propofol binding sites in a muscle-type nAChR by use of a photoreactive analog of propofol, 2-isopropyl-5-[3-(trifluoromethyl)-3H-diazirin-3-yl]phenol (AziPm). Based upon radioligand binding assays, AziPm stabilized the Torpedo nAChR in the resting state, whereas propofol stabilized the desensitized state. nAChR-rich membranes were photolabeled with [(3)H]AziPm, and labeled amino acids were identified by Edman degradation. [(3)H]AziPm binds at three sites within the nAChR transmembrane domain: (i) an intrasubunit site in the δ subunit helix bundle, photolabeling in the nAChR desensitized state (+agonist) δM2-18' and two residues in δM1 (δPhe-232 and δCys-236); (ii) in the ion channel, photolabeling in the nAChR resting, closed channel state (-agonist) amino acids in the M2 helices (αM2-6', βM2-6' and -13', and δM2-13') that line the channel lumen (with photolabeling reduced by >90% in the desensitized state); and (iii) at the γ-α interface, photolabeling αM2-10'. Propofol enhanced [(3)H]AziPm photolabeling at αM2-10'. Propofol inhibited [(3)H]AziPm photolabeling within the δ subunit helix bundle at lower concentrations (IC50 = 40 μm) than it inhibited ion channel photolabeling (IC50 = 125 μm). These results identify for the first time a single intrasubunit propofol binding site in the nAChR transmembrane domain and suggest that this is the functionally relevant inhibitory binding site.


Figures

FIGURE 1.
FIGURE 1.
Structures of propofol, its photoactive analog AziPm, and TID.
FIGURE 2.
FIGURE 2.
Propofol and AziPm differentially modulate the equilibrium binding of [3H]ACh and the channel blockers [3H]tetracaine and [3H]PCP. Propofol (♦) and AziPm (○) modulation of the equilibrium binding by Torpedo nAChR of [3H]ACh (A), [3H]tetracaine (+α-bungarotoxin) (B), and [3H]PCP (+Carb; desensitized state) (C) is shown. Binding was determined by centrifugation assay; nonspecific binding (Bns) was determined in the presence of excess competitor (1 mm Carb (A), 100 μm tetracaine (Tet) (B), or 100 μm PCP (C)). The specific radioligand binding at propofol or AziPm concentration x (BxBns) normalized to the specific binding in the absence of propofol or AziPm (B0Bns) is plotted with error bars representing S.D. for duplicate samples. A, propofol at 100 μm potentiates [3H]ACh binding by 20% similar to the potentiation by proadifen (▵). AziPm at 1 mm inhibited specific binding by >95% binding (IC50 = 134 ± 10 μm, nH = 2.5 ± 0.5). B, propofol inhibited specific binding of [3H]tetracaine by >95% but with a steep concentration dependence (IC50 = 125 ± 14 μm, nH = 1.6 ± 0.3). At concentrations up to 100 μm, AziPm produced a dose-dependent inhibition of binding with a nonspecific increase in binding seen at higher concentrations in either the absence (○) or presence (●) of 100 μm non-radioactive tetracaine. For AziPm concentrations ≤100 μm, the concentration dependence of inhibition (solid curve) was consistent with full inhibition at higher concentrations (IC50 = 12 ± 1 μm, nH = 0.94 ± 0.07). C, propofol maximally reduced [3H]PCP specific binding by ∼75%. The concentration dependence of inhibition was consistent with a Hill coefficient of 1 (IC50 = 47 ± 5 μm; B = 24 ± 2%, nH = 1.09 ± 0.09). As seen for [3H]tetracaine, at concentrations above 100 μm, AziPm increased [3H]PCP binding. At AziPm concentrations ≤100 μm, the concentration dependence of inhibition (solid curve) was consistent with full inhibition at higher concentrations (IC50 = 52 ± 6 μm, nH = 1).
FIGURE 3.
FIGURE 3.
Photoincorporation of [3H]AziPm into Torpedo nAChR-rich membranes (A and B) and within nAChR α subunit fragments (C). A, Torpedo nAChR-rich membranes were photolabeled with 1 μm [3H]AziPm in the absence (lane 1) or presence of other drugs (100 μm tetracaine (Tet) (lane 2), 100 μm PCP (lane 3), 300 μm propofol (PPF) (lane 4), 1 mm Carb (lane 5), 1 mm Carb and 100 μm PCP (lane 6), or 1 mm Carb and 300 μm propofol (lane 7)). Subunits were resolved by SDS-PAGE (representative Coomassie Blue stain shown in lane 8), and 3H incorporation into subunits was determined by fluorography (lanes 1–7). The mobilities of the α, β, γ, and δ nAChR subunits, rapsyn (Rsn), and the Na+/K+-ATPase α subunit (αNaK) are indicated. B, gel bands containing nAChR α, β, γ, and δ nAChR subunits and Na+/K+-ATPase α subunit were excised from duplicate gels, and 3H incorporation was determined by liquid scintillation counting. For each gel band, the average cpm ± S.D. (error bars) are plotted. C, nAChR α subunits were isolated from nAChR-rich membranes (400 μg of protein/∼650 pmol of ACh binding sites) photolabeled with [3H]AziPm in the absence of other drugs (Control) or in the presence of tetracaine (100 μm), propofol (300 μm), or Carb (1 mm). The isolated α subunit gel bands were loaded onto a second 15% polyacrylamide gel for in-gel digestion with V8 protease to produce four subunit fragments that were visualized by staining the gel with GelCode Blue (Pierce). The 3H incorporation within the excised gel bands was determined by liquid scintillation counting. The locations of the four subunit fragments within the α subunit primary structure are indicated above the graph.
FIGURE 4.
FIGURE 4.
Comparison of the propofol inhibition of [3H]AziPm photoincorporation in the δ subunit in the absence or presence of agonist. Torpedo nAChR-rich membranes were photolabeled with 1.5 μm [3H]AziPm in the absence (■) or presence (○) of Carb. Aliquots were also photolabeled in the presence of 0.1 mm tetracaine (−Carb) or 0.1 mm PCP (+Carb). After photolabeling, nAChR subunits were resolved by SDS-PAGE, and 3H incorporation in the excised δ subunits was determined by liquid scintillation counting. For each condition, the normalized subunit photolabeling, ((δx − δns)/(δ0 − δns)) × 100, was calculated from two gels with duplicate samples (mean ± S.D. (error bars)) where δx is the δ subunit 3H cpm at propofol concentration x, δ0 is the 3H cpm in the absence of propofol, and δns is the 3H cpm incorporated in the presence of 100 μm tetracaine (−Carb) or 300 μm propofol (+Carb). In the absence of Carb, δ0 and δns were 4,295 ± 50 and 1,300 ± 50 cpm, respectively. In the presence of Carb, δ0 and δns were 3,010 ± 15 and 1,170 ± 10 cpm, respectively (with 2,060 ± 15 cpm incorporated in the presence of 100 μm PCP). The concentration dependence of propofol inhibition of [3H]tetracaine binding (IC50 = 125 μm, nH = 1.6; from Fig. 2B) is plotted as the solid line, and the dotted line is the concentration dependence of inhibition of [3H]PCP binding (+Carb; IC50 = 47 μm, nH = 1.09; from Fig. 2C). For the direct fit of the concentration dependence of propofol inhibition of δ subunit photolabeling (+Carb), IC50 = 37 μm ± 8 and nH = 1.06 ± 0.2.
FIGURE 5.
FIGURE 5.
[3H]AziPm photolabeling within the δ subunit helix bundle is propofol-inhibitable and agonist-dependent. Quantification of 3H (●, ▵, and ▴) and PTH-amino acids (□) released during sequence analysis of Torpedo nAChR subunit fragments containing δM2 (A) and δM1 (B and C) isolated by SDS-PAGE and rpHPLC from EndoLys-C digests of nAChRs photolabeled with Carb (▵), with Carb + 300 μm propofol (▴), or without agonist or propofol (●) is shown. A and B, for nAChRs photolabeled with Carb ±300 μm propofol, upon sequencing the fragment beginning at δMet-257 (A, I0 = 34 pmol, both conditions), the major peak of 3H release in the presence of Carb (▵) in cycle 18 indicates photolabeling of δThr-274 (δM2-18′; 2.3 cpm/pmol) that propofol inhibited by 80%. The smaller peaks of 3H release in cycles 13 and 21 indicate photolabeling of δVal-269 (δM2-13′; 0.2 cpm/pmol) and δArg-277 (0.4 cpm/pmol) that propofol inhibited by 50 and 35%, respectively. B, the peaks of 3H release in cycles 27 and 31 seen when the fragment beginning at δPhe-206 was sequenced (I0 = 37 pmol, both conditions, with o-phthalaldehyde (OPA) treatment at cycle 20 (δPro-225)) indicate photolabeling of δPhe-232 (1.7 cpm/pmol) and δCys-236 (0.46 cpm/pmol) that propofol inhibited by 95 and 40%, respectively. C, when fractions enriched in the δPhe-206 fragment were sequenced from nAChRs photolabeled in the absence (●) or presence (▵) of Carb, the fragment beginning at δPhe-206 was the primary sequence (I0 = 7 pmol, both conditions (□)) with a secondary sequence beginning at δMet-257 (I0 = 0.5 pmol; not shown). For the +Carb sample, the peaks of 3H release in cycles 27 and 31 indicate photolabeling of δPhe-232 (10 cpm/pmol) and δCys-236 (3.2 cpm/pmol) that was reduced by >90% in the absence of Carb. For the −Carb sample, the peak of 3H release in cycle 13 resulted from photolabeling of δVal-269 (δM2-13′) in the secondary sequence that was reduced by >90% in the presence of agonist (see Fig. 7).
FIGURE 6.
FIGURE 6.
[3H]AziPm photolabeling within αM2. Quantification of 3H (●, ○, and ▵) and PTH-amino acids (□) released during sequence analysis of Torpedo nAChR subunit fragments containing αM2 isolated from nAChRs photolabeled with 1 μm [3H]AziPm without other drugs (●), with 300 μm propofol (○), or with 1 mm Carb (▵) is shown. A, for nAChRs photolabeled in the presence or absence of propofol, when sequencing the fragment beginning at αMet-243 (I0 = 4.3 pmol, both conditions), the peaks of 3H release in cycles 6 and 10 indicate photolabeling in the absence of propofol of αSer-248 (αM2-6′) at 14 cpm/pmol and αSer-252 (αM2-10′) at 8 cpm/pmol. In the presence of propofol, photolabeling of αM2-6′ was reduced to 5 cpm/pmol, whereas photolabeling of αM2-10′ was increased to 34 cpm/pmol. B, for nAChRs photolabeled in the presence or absence of Carb, the fragment beginning at αMet-243 was present at 4 pmol (+Carb; □) and at 8 pmol (−Carb; not plotted). For the −Carb condition, αM2-6′ and αM2-10′ were photolabeled (−Carb/+Carb) at 3.2/1.8 and 6.5/5.3 cpm/pmol, respectively.
FIGURE 7.
FIGURE 7.
Agonist- and propofol-inhibitable [3H]AziPm photolabeling in βM2 and δM2. Quantification of 3H (●, ▵, and ○) and PTH-amino acids (□) released during sequence analysis of Torpedo nAChR subunit fragments containing βM2 (A and B) and δM2 (C and D) isolated by SDS-PAGE and rpHPLC from trypsin or EndoLys-C digests of nAChRs photolabeled without agonist or propofol (●), with Carb (▵), or with 300 μm propofol (○) is shown. A and C, for nAChRs photolabeled in the presence or absence of Carb, when sequencing the fragment beginning at βMet-249 (A, I0 = 11 pmol, both conditions), the peaks of 3H release in cycles 6 and 13 (−Carb) indicate photolabeling of βSer-254 (βM2-6′) at 7.5 cpm/pmol and βVal-261 (βM2-13′) at 6.2 cpm/pmol that was reduced in the presence of Carb by >90%. When sequencing the fragment beginning at δMet-257 (C, I0 = 20 pmol, both conditions), the peak of 3H release in cycle 13 (−Carb) indicates photolabeling of δVal-269 (δM2-13′) at 48 cpm/pmol that Carb reduced by >90%. In the presence of Carb, the peak of 3H release in cycle 18 indicates photolabeling of δThr-274 (δM2-18′) at 16 cpm/pmol. B and D, for nAChRs photolabeled in the presence or absence of propofol, when sequencing the fragment beginning at βMet-249 (B, I0 = 6 pmol, both conditions), the peaks of 3H release in cycles 6 and 13 (−Carb) indicate photolabeling of βM2-6′ and βM2-13′ at 5.2 and 4.5 cpm/pmol, respectively, that propofol reduced by ∼90%. When sequencing the fragment beginning at δMet-257 (D, I0 = 15 pmol, both conditions), the peak of 3H release in cycle 13 (−Carb) indicates photolabeling of δM2-13′ at 28 cpm/pmol that propofol reduced by 85%.
FIGURE 8.
FIGURE 8.
Agonist-independent [3H]AziPm photolabeling in nAChR M3 and M4 helices. Quantification of 3H (● and ▵) and PTH-amino acids (□) released during sequence analysis of Torpedo nAChR subunit fragments beginning near the N termini of γM3 (A), δM3 (B), and αM4 (C) from Torpedo nAChR photolabeled with 1 μm [3H]AziPm in the absence (●) or presence (▵) of Carb (1 mm) is shown. The γ and δ subunit fragments were isolated by rpHPLC from V8 protease digests and chemically isolated during sequence analysis by treatment with o-phthalaldehyde (OPA) at cycle 6 of Edman degradation (see “Experimental Procedures”). The α subunit fragment was isolated by rpHPLC fractionation of a trypsin digest of αV8-10. A and B, when sequencing the fragments beginning at γThr-276 (A, I0 (−Carb/+Carb) = 11/17 (□) pmol) and δThr-281 (B, I0 (−Carb/+Carb) = 19/40 (□) pmol), the peaks of 3H release in cycle 25 (−Carb) indicate photolabeling of γAsn-300 and δAsn-305 at 1.5 and 2.5 cpm/pmol, respectively. For the +Carb samples, γAsn-300 was photolabeled at 1.7 cpm/pmol. Because of a sequencer failure at cycle 20, data were not obtained for δAsn-305 (+Carb). C, when sequencing the fragment beginning at αTyr-401 (I0 (−Carb/+Carb) = 36/44 (□) pmol), the peaks of 3H release in cycle 12 and 18 indicate photolabeling (−Carb/+Carb) of αCys-412 and αCys-418 at 6.4/6.1 and 2.7/1.5 cpm/pmol, respectively.
FIGURE 9.
FIGURE 9.
[3H]AziPm binding sites in the Torpedo nAChR transmembrane domain. A, side view of the extracellular and transmembrane domains of the T. californica nAChR (α, gold; β, blue; γ, green; δ, magenta) based upon the T. marmorata nAChR structure (Protein Data Bank code 2BG9) with Carb (red Connolly surface) in the ACh binding sites. A Connolly surface of a single AziPm molecule, colored by atom (178 Å3), is included for comparison. B, view of the Torpedo nAChR transmembrane domain from the bottom of the extracellular domain, including in Connolly surface representation the ensembles of the 15 AziPm molecules docked with lowest CDOCKER interaction energy within (i) the δ subunit helix bundle (471 Å3), (ii) the ion channel (486 Å3), and (iii) the γ-α interface (348 Å3). The photolabeled amino acids are represented in stick format (i) within the δ subunit helix bundle (in green; δThr-274, δPhe-232, and δCys-236), (ii) within the ion channel (in cyan; αSer-248, βSer-254, βVal-261, and δVal-269), and (iii) within the γ-α interface (in red; αSer-252). C, enlarged side view of the nAChR transmembrane domain with the γ and αδ subunits and the M4 helices of the αγ, β, and δ subunits removed for better visibility of the photolabeled amino acids and the AziPm binding pockets in the δ subunit helix bundle and in the ion channel.

Similar articles

Cited by

References

    1. Krasowski M. D., Jenkins A., Flood P., Kung A. Y., Hopfinger A. J., Harrison N. L. (2001) General anesthetic potencies of a series of propofol analogs correlate with potency for potentiation of γ-aminobutyric acid (GABA) current at the GABA(A) receptor but not with lipid solubility. J. Pharmacol. Exp. Ther. 297, 338–351 - PubMed
    1. Rudolph U., Antkowiak B. (2004) Molecular and neuronal substrates for general anaesthetics. Nat. Rev. Neurosci. 5, 709–720 - PubMed
    1. Franks N. P. (2008) General anaesthesia: from molecular targets to neuronal pathways of sleep and arousal. Nat. Rev. Neurosci. 9, 370–386 - PubMed
    1. Flood P., Ramirez-Latorre J., Role L. (1997) α4β2 neuronal nicotinic acetylcholine receptors in the central nervous system are inhibited by isoflurane and propofol, but α7-type nicotinic acetylcholine receptors are unaffected. Anesthesiology 86, 859–865 - PubMed
    1. Violet J. M., Downie D. L., Nakisa R. C., Lieb W. R., Franks N. P. (1997) Differential sensitivities of mammalian neuronal and muscle nicotinic acetylcholine receptors to general anesthetics. Anesthesiology 86, 866–874 - PubMed

Publication types

LinkOut - more resources