. 2013 Mar 1;288(9):6140-53.
doi: 10.1074/jbc.M112.409789. Epub 2013 Jan 8.

Structural and functional similarities of calcium homeostasis modulator 1 (CALHM1) ion channel with connexins, pannexins, and innexins

Affiliations

Structural and functional similarities of calcium homeostasis modulator 1 (CALHM1) ion channel with connexins, pannexins, and innexins

Adam P Siebert et al. J Biol Chem. .

Abstract

CALHM1 (calcium homeostasis modulator 1) forms a plasma membrane ion channel that mediates neuronal excitability in response to changes in extracellular Ca(2+) concentration. Six human CALHM homologs exist with no homology to other proteins, although CALHM1 is conserved across >20 species. Here we demonstrate that CALHM1 shares functional and quaternary and secondary structural similarities with connexins and evolutionarily distinct innexins and their vertebrate pannexin homologs. A CALHM1 channel is a hexamer, comprised of six monomers, each of which possesses four transmembrane domains, cytoplasmic amino and carboxyl termini, an amino-terminal helix, and conserved extracellular cysteines. The estimated pore diameter of the CALHM1 channel is ∼14 Å, enabling permeation of large charged molecules. Thus, CALHMs, connexins, and pannexins and innexins are structurally related protein families with shared and distinct functional properties.


Figures
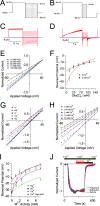
FIGURE 1.
FIGURE 1.
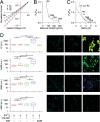
CALHM1 is a poorly selective ion channel. A, divalent-free voltage protocol. B, divalent voltage protocol. C, representative families of current traces from CALHM1-expressing (red) and control (blue) oocytes in response to the divalent-free voltage protocol shown in A and described under “Experimental Procedures.” Oocytes were bathed in a solution containing 100 mm NaCl, 10 mm HEPES, 0.5 mm EGTA, 0.5 mm EDTA, pH 7.3. D, representative families of current traces from CALHM1-expressing (red) and control (blue) oocytes in response to the divalent voltage protocol shown in B and described under “Experimental Procedures.” Oocytes were bathed in a solution containing 100 mm NaCl, 2 mm CaCl2, 10 mm HEPES, pH 7.3. E, normalized instantaneous I-V curves from representative CALHM1-expressing oocyte. Increasing [NaCl]o depolarized Erev. The solid lines are linear fits. F, permeabilities of K+, Cl, and Ca2+ relative to Na+ were determined by plotting Erev from Erev versus [NaCl]o in the absence (red) or presence (black) of extracellular Ca2+, and the solid lines were calculated by fitting the data with either the Goldman-Hodgkin-Katz constant field equation (Equation 1) or the extended constant field equation (Equations 2–5), respectively. G, normalized instantaneous I-V curves from representative CALHM1-expressing oocytes bathed in 100 mm monovalent cation solutions. Shifts in Erev enabled calculation of relative permeabilities. Solid lines, linear fits. H, normalized instantaneous I-V curves from representative CALHM1-expressing oocytes bathed in various [Ca2+]o. Increasing [Ca2+]o depolarized Erev. Solid lines, linear fits. I, relative permeabilities of divalent cations (M2+) were determined by plotting Erev from H versus bath M2+ activity, and the solid lines were derived from fitting the data with the constant field equation (Equations 2–5). J, pharmacology of CALHM1 currents. Averaged, normalized currents (mean ± S.E.) are shown for 1 mm probenecid (green, n = 4), 30 μm mefloquine (red, n = 4), and 200 μm quinine (blue, n = 4). Black line, currents recorded in control oocyte injected only with Cx38 antisense oligonucleotide, normalized to the average CALHM1 currents (7.8 ± 1.1 μA, n = 12) from the same batch of oocytes.
FIGURE 2.
FIGURE 2.
The ion-conducting pore of CALHM1 is wide. A, normalized instantaneous I-V curves of representative CALHM1-expressing oocytes bathed in various sized tetraalkylammonium cations (Table 2) using the divalent-free voltage protocol (Fig. 1A). Solid lines, linear fits; error bars, S.E. B, plot of relative permeability of each cation against its molecular mass is an exponential relationship. C, plot of relative permeability of each cation versus its respective ionic radius. Fitting data with the volume exclusion equation (blue curve; Equation 9) estimates a pore diameter of 12.8 Å. Fitting data with the volume exclusion equation including a term for the viscous drag of the ion (red curve; Equation 10) estimates a pore diameter of 14.2 Å. Relative permeabilities of monovalent cations from Fig. 1G are plotted versus their Stokes radii (green triangles). D, left, box plots of fluorescence intensities of intracellular Lucifer Yellow, Alexa488, Alexa594, and Alexa633 taken up by mock- and CALHM1-transfected cells in the presence (5 mm) or absence of extracellular Ca2+ to inhibit or activate CALHM1 opening, respectively (data plotted on log scale). Numbers of cells for each condition ranged from 316 to 1489. For each box plot, the middle line represents the median; upper and lower bounds of the box represent 75th and 25th percentiles, respectively; and upper and lower tails represent 90th and 10th percentiles, respectively. For each dye, median fluorescence intensities were compared between transfection conditions and extracellular calcium conditions only, using the Kruskal-Wallis test. Therefore, statistical significance was adjusted to correct for multiple comparisons; °, p < 0.01; *, p < 0.0125. Cells not expressing CALHM1 and cells incubated in solutions containing 5 mm Ca2+ showed background levels of fluorescence. Right, representative fluorescence images in dye uptake experiments. Regions of interest (blue traces) were drawn around morphologically normal cells in each field. Left, mock-transfected cells incubated in solutions containing 0 Ca2+. Middle, CALHM1-transfected cells incubated in solutions containing 5 mm Ca2+. Right, CALHM1-transfected cells incubated in solutions containing 0 Ca2+. RuR, Ruthenium Red. a.u., arbitrary units.
FIGURE 3.
FIGURE 3.
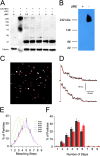
CALHM1 channel is a hexamer. A, SDS-PAGE of N2a cells transiently transfected with GFP or CALHM1 with increasing concentrations of βME. B, BN-PAGE of SH-SY5Y cells transiently transfected with CALHM1 under reducing and non-reducing conditions. The absence of lower molecular mass bands in reducing conditions (+βME) is probably due to altered structure of CALHM1 that allows the reduced protein to migrate through the gel quickly. Because the experiment was optimized to detect higher order oligomers, monomeric CALHM1 probably runs through the gel. C, representative TIRF image of CALHM1-EGFP in oocyte plasma membrane acquired before photobleaching, showing fluorescent spots and regions of interest used to measure fluorescence intensity. D, representative fluorescence intensity traces from two fluorescent spots. Steps found using StepFinder (red line) are overlaid on the fluorescence intensity measurement (black line). After determining the number of steps in each bleaching trace, traces shown here were smoothed using a 5-point running average for display purposes. E, distribution of the number of bleaching steps observed from CALHM1-EGFP-expressing oocytes. Black data points, the average percentage of particles that bleached in each number of bleaching steps. Error bars, S.E. Data obtained from 271 particles, eight imaging records, and three oocytes were fitted with a binomial equation assuming the number of monomers in the complex and with the percentage of fluorescent GFP molecules being a free parameter (colored, dashed lines). F, distribution of the number of bleaching steps observed using different methods to identify bleaching steps. The same traces that were analyzed using StepFinder and summarized in E (black bars) were also analyzed by visual inspection (red bars) to identify bleaching steps. Error bars, S.E.
FIGURE 4.
FIGURE 4.
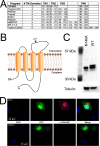
Membrane topology of CALHM1. A, predicted membrane-spanning regions from nine membrane topology prediction programs. B, model membrane topology of four TM domains; three cytoplasmic domains, including the amino and carboxyl termini; and two extracellular domains. C, CALHM1 is N-glycosylated at Asn-140. Western blot of wild type CALHM1 reveals two bands, whereas CALHM1 with Asn-140 mutated to alanine (N140A) reveals only the lower band, indicating that CALHM1 is glycosylated at Asn-140, indicating extracellular localization. D, the carboxyl terminus is cytoplasmic. Top, permeabilized PC12 cells expressing CALHM1 were exposed to CALHM1 carboxyl-terminal antibody, revealing a positive immunostaining signal (right center panel). Bottom, unpermeabilized PC12 cells expressing CALHM1 exposed to the same antibody had no immunostaining signal (right center panel). Transfected cells were identified by EGFP expressed by the same vector. A similar strategy to localize the amino terminus was unsuccessful because insertion of an epitope tag prevented CALHM1 expression.
FIGURE 5.
FIGURE 5.
CALHM1 does not form gap junctions. A, representative images of dye transfer in N2a cells transiently transfected with either GFP-tagged CALHM1 (top row) or GFP-tagged Cx30 (bottom row). In a group of transfected cells, a single cell was loaded with Alexa350 by a patch clamp whole-cell dialysis for 5 min (arrowhead). Fluorescence images were taken 5–60 min after loading to determine the extent of Alexa350 transfer to other cells. B, percentage of injected cells that transferred dye to neighboring transfected cells. Only one of 12 dye-loaded CALHM1-transfected cells examined transferred dye, and it was transferred to only one other cell, probably a daughter cell that had not yet completed cytokinesis (89), similar to what was observed in the GFP-transfected cells. Conversely, 9 of 11 of the Cx30-transfected cells transferred dye to neighboring transfected cells. Furthermore, the dye was transferred to multiple cells in six of eight cases. Eight GFP-expressing or untransfected, 11 Cx30-expressing, and 12 CALHM1-expressing cells were injected with dye. Statistical significance was determined using Fisher's exact test, p < 0.001. C, average number of cells into which dye transferred. The one injected control cell and one injected CALHM1-transfected cell that transferred dye transferred it to only one neighboring cell. Alternatively, when Cx30-transfected cells transferred dye, there were on average 2.44 recipient cells (Student's unpaired t test with unequal variance, p < 0.01). DIC, differential interference contrast.
FIGURE 6.
FIGURE 6.
Schematic depiction of the alignment of the secondary structures of CALHM1, Panx1, Cx43, and Inx1. Conserved cysteines and glycosylation sites are also shown.

Similar articles

Cited by

References

    1. Dreses-Werringloer U., Lambert J. C., Vingtdeux V., Zhao H., Vais H., Siebert A., Jain A., Koppel J., Rovelet-Lecrux A., Hannequin D., Pasquier F., Galimberti D., Scarpini E., Mann D., Lendon C., Campion D., Amouyel P., Davies P., Foskett J. K., Campagne F., Marambaud P. (2008) A polymorphism in CALHM1 influences Ca2+ homeostasis, Aβ levels, and Alzheimer's disease risk. Cell 133, 1149–1161 - PMC - PubMed
    1. Lambert J. C., Amouyel P. (2007) Genetic heterogeneity of Alzheimer's disease. Complexity and advances. Psychoneuroendocrinology 32, S62–S70 - PubMed
    1. Ma Z., Siebert A. P., Cheung K. H., Lee R. J., Johnson B., Cohen A. S., Vingtdeux V., Marambaud P., Foskett J. K. (2012) Calcium homeostasis modulator 1 (CALHM1) is the pore-forming subunit of an ion channel that mediates extracellular Ca2+ regulation of neuronal excitability. Proc. Natl. Acad. Sci. U.S.A. 109, E1963–E1971 - PMC - PubMed
    1. Gallego-Sandín S., Alonso M. T., García-Sancho J. (2011) Calcium homoeostasis modulator 1 (CALHM1) reduces the calcium content of the endoplasmic reticulum (ER) and triggers ER stress. Biochem. J. 437, 469–475 - PubMed
    1. Moreno-Ortega A. J., Ruíz-Nuño A., García A. G., Cano-Abad M. F. (2010) Mitochondria sense with different kinetics the calcium entering into HeLa cells through calcium channels CALHM1 and mutated P86L-CALHM1. Biochem. Biophys. Res. Commun. 391, 722–726 - PubMed

Publication types