

Reprogramming of the microRNA transcriptome mediates resistance to rapamycin
- PMID: 23300087
- PMCID: PMC3585042
- DOI: 10.1074/jbc.M112.416446
Reprogramming of the microRNA transcriptome mediates resistance to rapamycin
Abstract
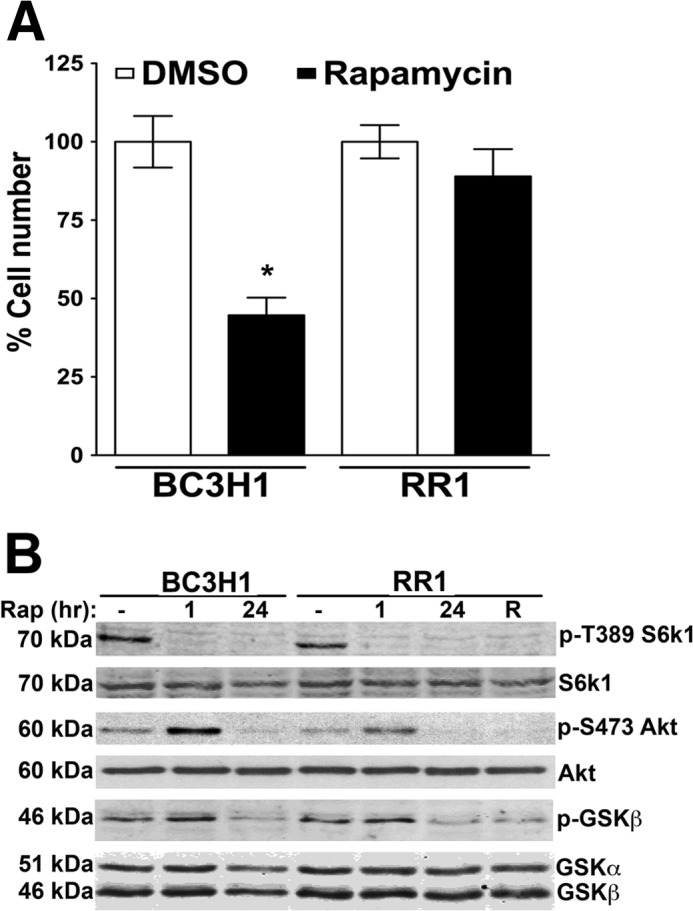
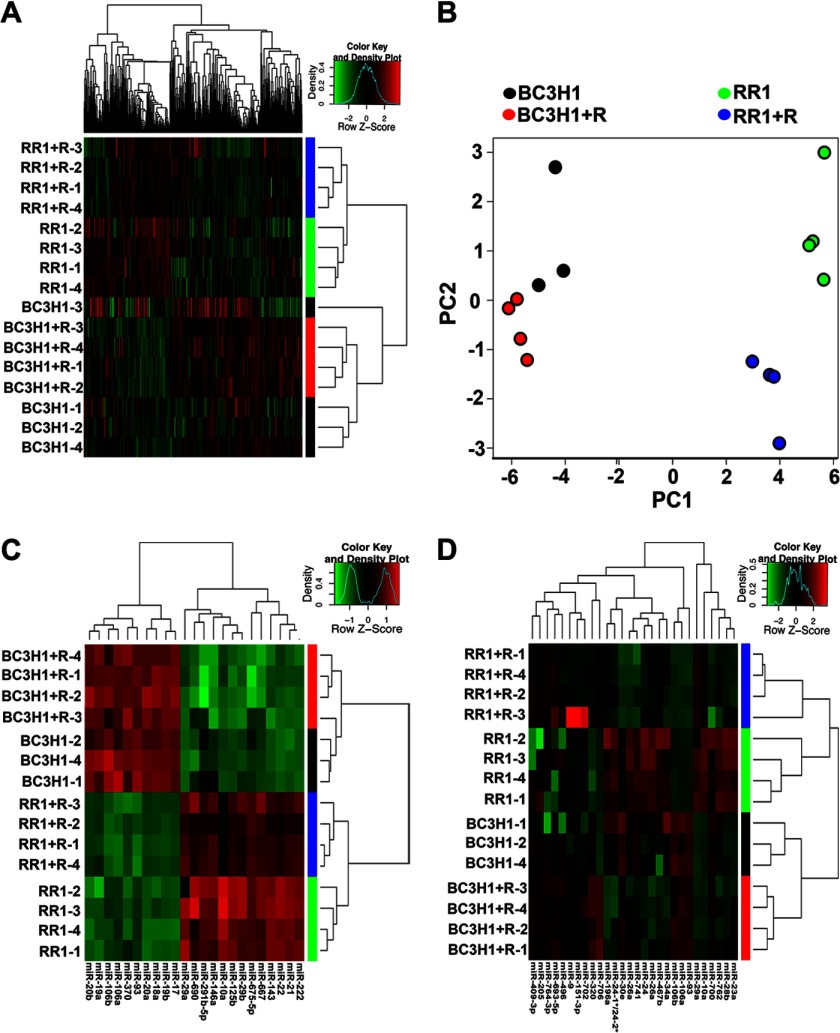
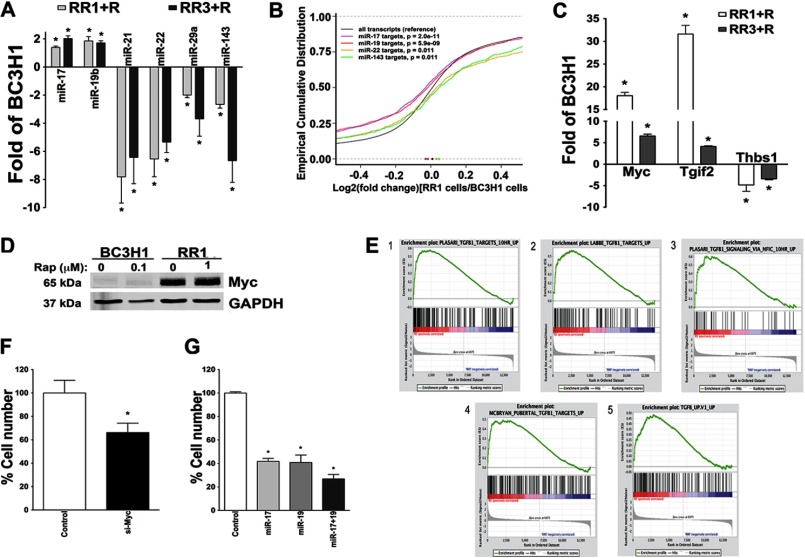
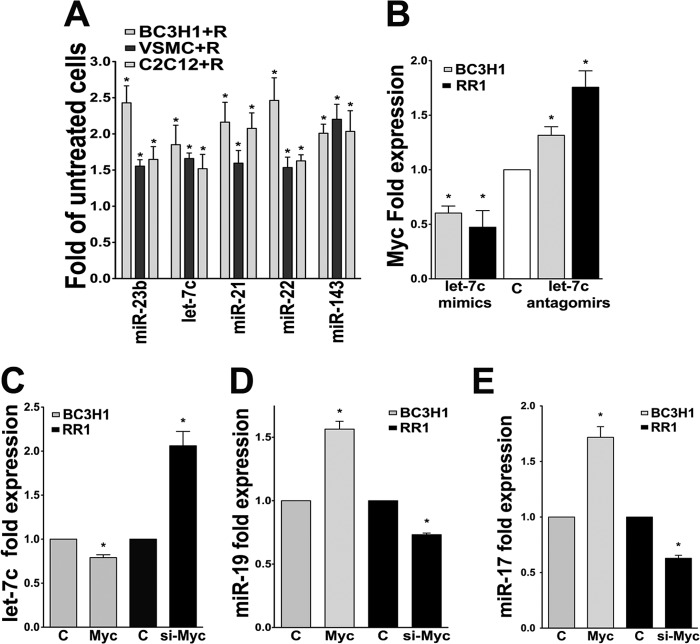
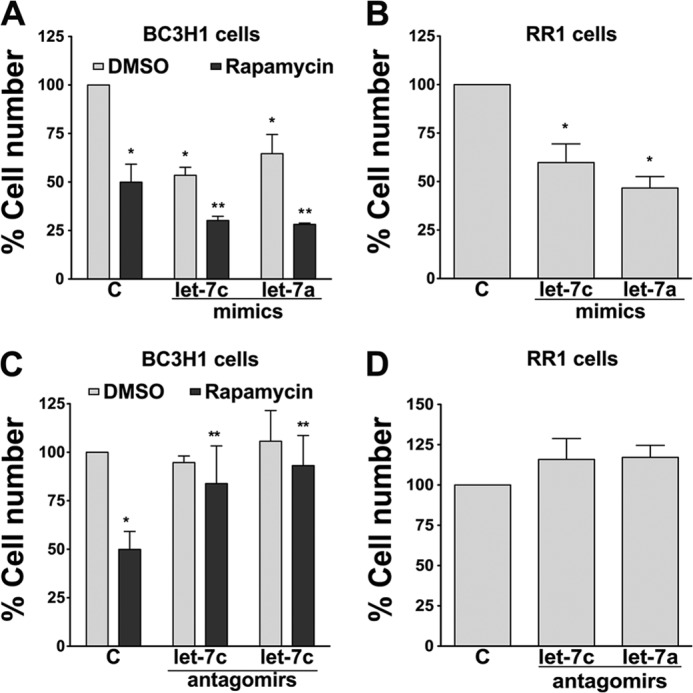
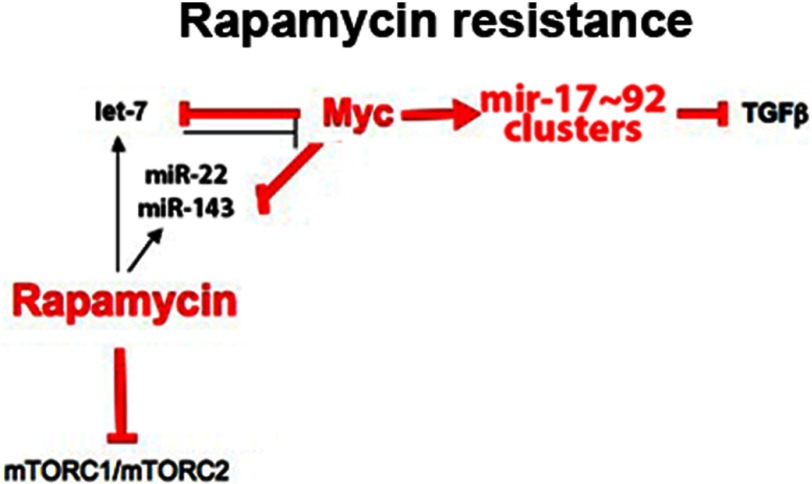
The mammalian target of rapamycin (mTOR) is a central regulator of cell proliferation that is often deregulated in cancer. Inhibitors of mTOR, including rapamycin and its analogues, are being evaluated as antitumor agents. For their promise to be fulfilled, it is of paramount importance to identify the mechanisms of resistance and develop novel therapies to overcome it. Given the emerging role of microRNAs (miRNAs) in tumorigenesis, we hypothesized that miRNAs could play important roles in the response of tumors to mTOR inhibitors. Long-term rapamycin treatment showed extensive reprogramming of miRNA expression, characterized by up-regulation of miR-17-92 and related clusters and down-regulation of tumor suppressor miRNAs. Inhibition of members of the miR-17-92 clusters or delivery of tumor suppressor miRNAs restored sensitivity to rapamycin. This study identifies miRNAs as new downstream components of the mTOR-signaling pathway, which may determine the response of tumors to mTOR inhibitors. It also identifies potential markers to assess the efficacy of treatment and provides novel therapeutic targets to treat rapamycin-resistant tumors.
Figures
Similar articles
-
mTOR-dependent regulation of PHLPP expression controls the rapamycin sensitivity in cancer cells.J Biol Chem. 2011 Feb 25;286(8):6510-20. doi: 10.1074/jbc.M110.183087. Epub 2010 Dec 22. J Biol Chem. 2011. PMID: 21177869 Free PMC article.
-
Akt inhibitors MK-2206 and nelfinavir overcome mTOR inhibitor resistance in diffuse large B-cell lymphoma.Clin Cancer Res. 2012 May 1;18(9):2534-44. doi: 10.1158/1078-0432.CCR-11-1407. Epub 2012 Feb 14. Clin Cancer Res. 2012. PMID: 22338016 Free PMC article.
-
Rapamycin-induced autophagy plays a pro-survival role by enhancing up-regulation of intracellular ferritin expression in acute lymphoblastic leukemia.Exp Oncol. 2020 Mar;42(1):11-15. doi: 10.32471/exp-oncology.2312-8852.vol-42-no-1.14067. Exp Oncol. 2020. PMID: 32231197
-
The Enigma of Rapamycin Dosage.Mol Cancer Ther. 2016 Mar;15(3):347-53. doi: 10.1158/1535-7163.MCT-15-0720. Epub 2016 Feb 25. Mol Cancer Ther. 2016. PMID: 26916116 Free PMC article. Review.
-
Mammalian target of rapamycin: a central node of complex signaling cascades.Int J Clin Exp Pathol. 2011 Jun 20;4(5):476-95. Epub 2011 Jun 14. Int J Clin Exp Pathol. 2011. PMID: 21738819 Free PMC article. Review.
Cited by
-
mTOR inhibitors in urinary bladder cancer.Tumour Biol. 2016 Sep;37(9):11541-11551. doi: 10.1007/s13277-016-5083-1. Epub 2016 May 27. Tumour Biol. 2016. PMID: 27235118 Review.
-
Nucleotide Modification Alters MicroRNA-Dependent Silencing of MicroRNA Switches.Mol Ther Nucleic Acids. 2019 Mar 1;14:339-350. doi: 10.1016/j.omtn.2018.12.007. Epub 2018 Dec 18. Mol Ther Nucleic Acids. 2019. PMID: 30665183 Free PMC article.
-
Impaired phosphorylation and ubiquitination by p70 S6 kinase (p70S6K) and Smad ubiquitination regulatory factor 1 (Smurf1) promote tribbles homolog 2 (TRIB2) stability and carcinogenic property in liver cancer.J Biol Chem. 2013 Nov 22;288(47):33667-33681. doi: 10.1074/jbc.M113.503292. Epub 2013 Oct 2. J Biol Chem. 2013. PMID: 24089522 Free PMC article.
-
Small biomarkers with massive impacts: PI3K/AKT/mTOR signalling and microRNA crosstalk regulate nasopharyngeal carcinoma.Biomark Res. 2022 Jul 26;10(1):52. doi: 10.1186/s40364-022-00397-x. Biomark Res. 2022. PMID: 35883139 Free PMC article. Review.
-
Rapamycin limits CD4+ T cell proliferation in simian immunodeficiency virus-infected rhesus macaques on antiretroviral therapy.J Clin Invest. 2022 May 16;132(10):e156063. doi: 10.1172/JCI156063. J Clin Invest. 2022. PMID: 35316218 Free PMC article.
References
-
- Kim D. H., Sarbassov D. D., Ali S. M., King J. E., Latek R. R., Erdjument-Bromage H., Tempst P., Sabatini D. M. (2002) mTOR interacts with raptor to form a nutrient-sensitive complex that signals to the cell growth machinery. Cell 110, 163–175 - PubMed
-
- Sarbassov D. D., Ali S. M., Kim D. H., Guertin D. A., Latek R. R., Erdjument-Bromage H., Tempst P., Sabatini D. M. (2004) Rictor, a novel binding partner of mTOR, defines a rapamycin-insensitive and raptor-independent pathway that regulates the cytoskeleton. Curr. Biol. 14, 1296–1302 - PubMed
-
- Sabatini D. M. (2006) mTOR and cancer: insights into a complex relationship. Nat. Rev. Cancer 6, 729–734 - PubMed
-
- Sarbassov D. D., Ali S. M., Sabatini D. M. (2005) Growing roles for the mTOR pathway. Curr. Opin. Cell Biol. 17, 596–603 - PubMed
-
- Sarbassov D. D., Guertin D. A., Ali S. M., Sabatini D. M. (2005) Phosphorylation and regulation of Akt/PKB by the rictor-mTOR complex. Science 307, 1098–1101 - PubMed
Publication types
MeSH terms
Substances
Associated data
- Actions
Grants and funding
LinkOut - more resources
Full Text Sources
Other Literature Sources
Molecular Biology Databases
Miscellaneous
