. 2013 Jan 22;110(4):1518-23.
doi: 10.1073/pnas.1210126110. Epub 2013 Jan 8.

Decoding the anatomical network of spatial attention

Affiliations

Decoding the anatomical network of spatial attention

David V Smith et al. Proc Natl Acad Sci U S A. .

Abstract

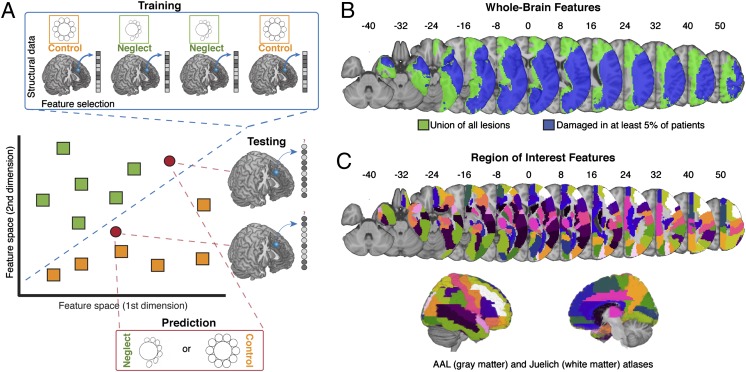
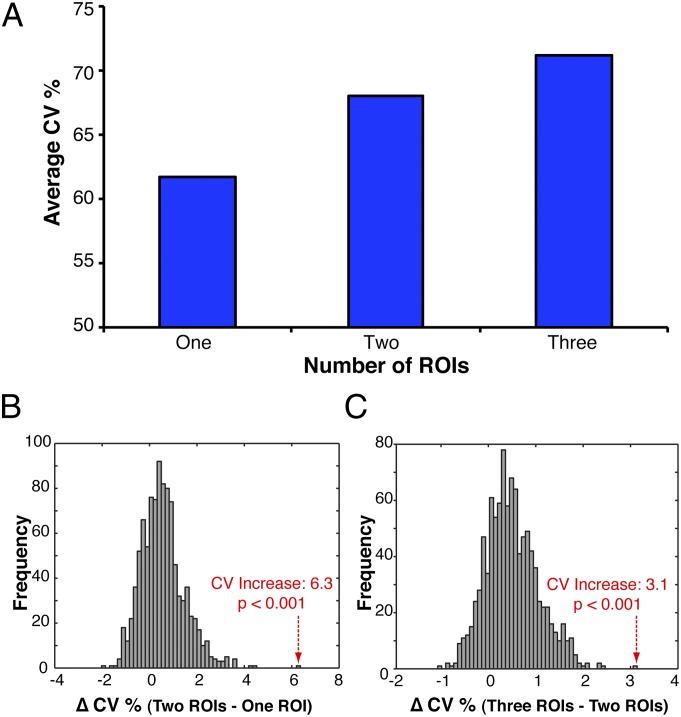
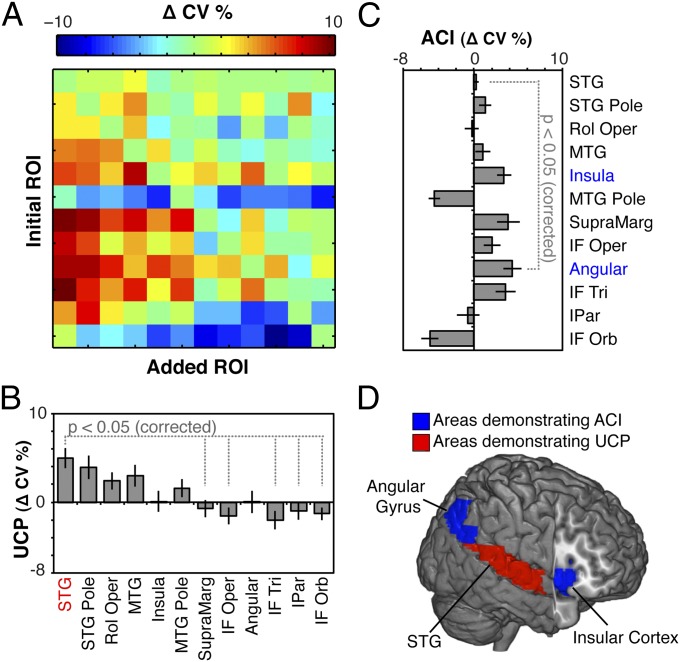
The study of stroke patients with modern lesion-symptom analysis techniques has yielded valuable insights into the representation of spatial attention in the human brain. Here we introduce an approach--multivariate pattern analysis--that no longer assumes independent contributions of brain regions but rather quantifies the joint contribution of multiple brain regions in determining behavior. In a large sample of stroke patients, we found patterns of damage more predictive of spatial neglect than the best-performing single voxel. In addition, modeling multiple brain regions--those that are frequently damaged and, importantly, spared--provided more predictive information than modeling single regions. Interestingly, we also found that the superior temporal gyrus demonstrated a consistent ability to improve classifier performance when added to other regions, implying uniquely predictive information. In sharp contrast, classifier performance for both the angular gyrus and insular cortex was reliably enhanced by the addition of other brain regions, suggesting these regions lack independent predictive information for spatial neglect. Our findings highlight the utility of multivariate pattern analysis in lesion mapping, furnishing neuroscience with a modern approach for using lesion data to study human brain function.


Conflict of interest statement

The authors declare no conflict of interest.

Figures

Fig. 1.
Fig. 1.
Multivariate analytic approach. (A) We used a MVPA procedure for using brain injury maps to predict the presence or absence of spatial neglect. MVPA involves both training and testing a predictive model. The training procedure used machine-learning algorithms [support vector machines (SVMs)] to construct a model of how distributed patterns of lesion data indicate the presence or absence of spatial neglect. The constructed model is then tested on new data (i.e., not used to train the model). This procedure was repeated for each individual in our dataset (n = 140), meaning each individual was tested on a model that was built independently of that individual’s data. The average of those predictions is the predictive power of the model. The algorithm can be trained on various features—in this case voxels from different regions of the brain—to predict the presence or absence of neglect. The feature space is typically very high dimensional, as many voxels are available, but the figure displays a simple 2D case for illustrative purposes. (B) Feature spaces used for our whole-brain analyses included both the set of voxels equal to the union of all individual right-hemisphere lesions (green) and voxels containing lesions found in at least 5% of the subject population (blue). (C) We also generated more selective feature spaces (n = 56) using regions of interest from the AAL (gray matter) and Juelich (white matter) atlases. Axial slice numbers are provided in terms of MNI space.
Fig. 2.
Fig. 2.
Modeling multiple brain regions improves predictive power. (A) To evaluate whether including more regions provides additional predictive power, we show the average CV percentages across all single ROIs (n = 45), all combinations of two ROIs (n = 990), and all combinations of three ROIs (n = 14,190). Because the underlying distribution corresponding to changes in average CV percentage is unknown, we constructed null distributions running all analyses 1,000 times with permuted neglect and control labels. For each permutation, we computed the change in average CV percentage for both comparisons (i.e., 2 ROIs – 1 ROI; and 3 ROIs – 2 ROIs). (B) In comparing the true CV to the null distribution, we found that the average CV significantly increased when adding one ROI to another ROI (CVincrease = 6.3, P < 0.001; red arrow). (C) Additionally, in a similar statistical test, we found that the average CV significantly increased when adding one ROI to two ROIs (CVincrease = 3.1, P < 0.001; red arrow). Data in histograms are partitioned into 50 equally spaced bins on the x-axis.
Fig. 3.
Fig. 3.
Combinatoric analyses control for lesion size while revealing robustly predictive brain regions. (A) To examine the interaction of information contained in each of the 12 critical perisylvian ROIs in the right hemisphere that were previously associated with spatial neglect in the literature, we examined all combinations of two ROIs. We then computed, iteratively, the change in CV percentages when adding ROIs to each other. Crucially, these changes in CV percentages explicitly factor in lesion size, as this feature is present in all cells of the 12 × 12 matrix. (B) The STG was the only region that consistently added predictive power to other ROIs, indicating significant unique combinatorial performance (UCP) (Eq. S1). Pairwise comparisons revealed that UCP for STG was greater than several other regions, including the supramarginal gyrus, the three divisions of the right inferior frontal gyrus (pars opercularis: IF Oper; pars triangularis: IF Tri; pars orbitalis: IF Orb), and the inferior parietal lobe (IPar). (C) In contrast, classifier performance for two regions, angular gyrus and insula, was consistently improved by the addition of other regions, indicating significant average combinatorial improvement (ACI) (Eq. S2). Pairwise comparisons revealed that ACI for angular gyrus was greater than STG. (D) Summary of brain regions demonstrating significant UCP (red) and ACI (blue). Error bars in B and C indicate SEM.

References

    1. Fellows LK, et al. Method matters: An empirical study of impact in cognitive neuroscience. J Cogn Neurosci. 2005;17(6):850–858. - PubMed
    1. Rorden C, Karnath H-O. Using human brain lesions to infer function: A relic from a past era in the fMRI age? Nat Rev Neurosci. 2004;5(10):813–819. - PubMed
    1. Bates E, et al. Voxel-based lesion-symptom mapping. Nat Neurosci. 2003;6(5):448–450. - PubMed
    1. Rorden C, Fridriksson J, Karnath HO. An evaluation of traditional and novel tools for lesion behavior mapping. Neuroimage. 2009;44(4):1355–1362. - PMC - PubMed
    1. Haynes JD, Rees G. Decoding mental states from brain activity in humans. Nat Rev Neurosci. 2006;7(7):523–534. - PubMed

Publication types

LinkOut - more resources