. 2012;10(12):e1001461.
doi: 10.1371/journal.pbio.1001461. Epub 2012 Dec 27.

ELF5 suppresses estrogen sensitivity and underpins the acquisition of antiestrogen resistance in luminal breast cancer

Affiliations

ELF5 suppresses estrogen sensitivity and underpins the acquisition of antiestrogen resistance in luminal breast cancer

Maria Kalyuga et al. PLoS Biol. 2012.

Abstract

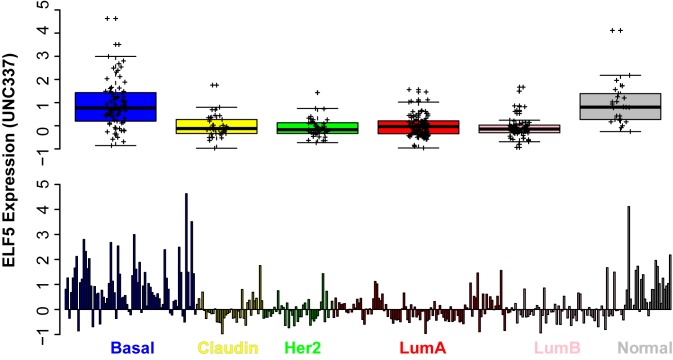
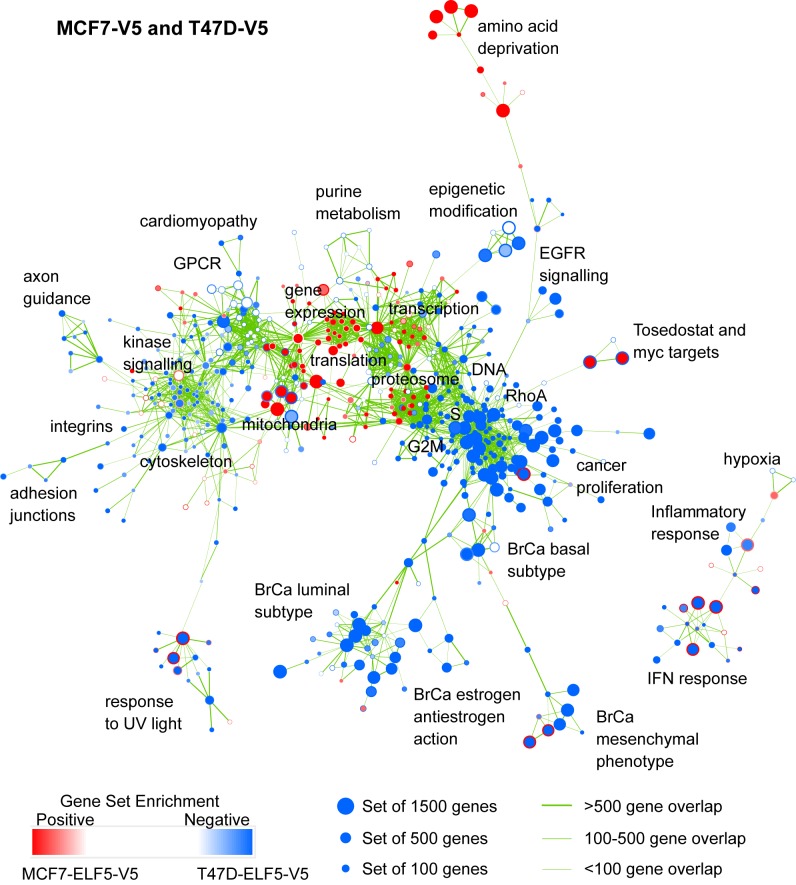
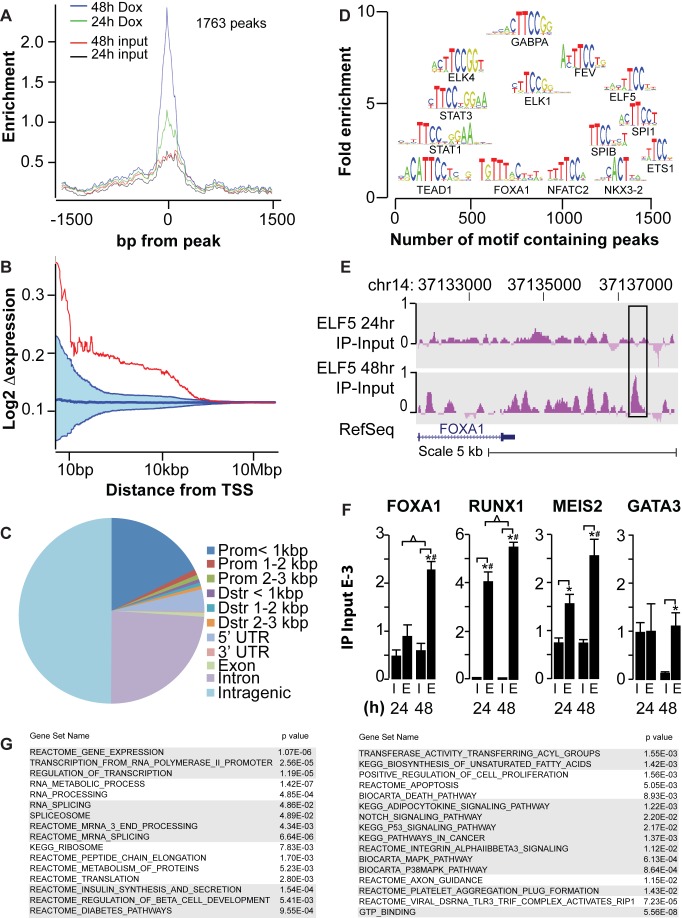
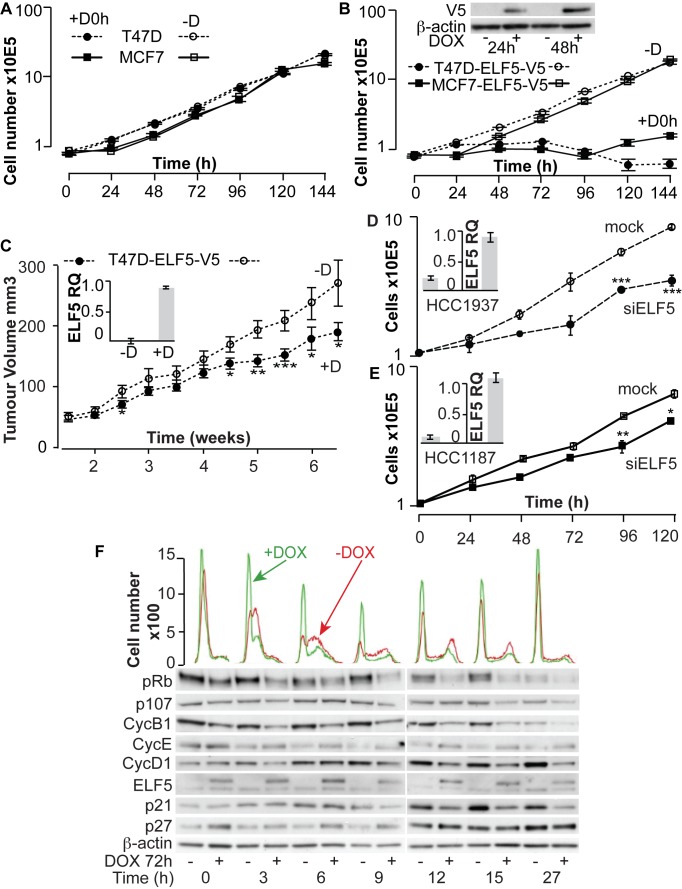
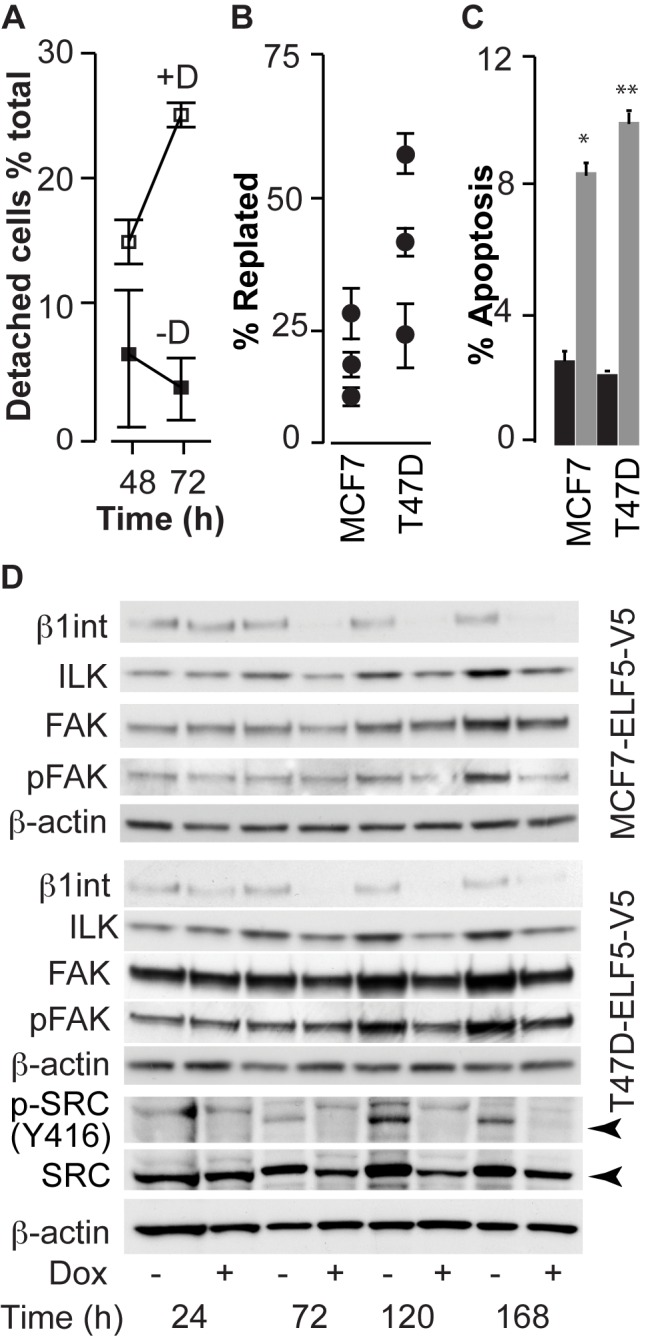
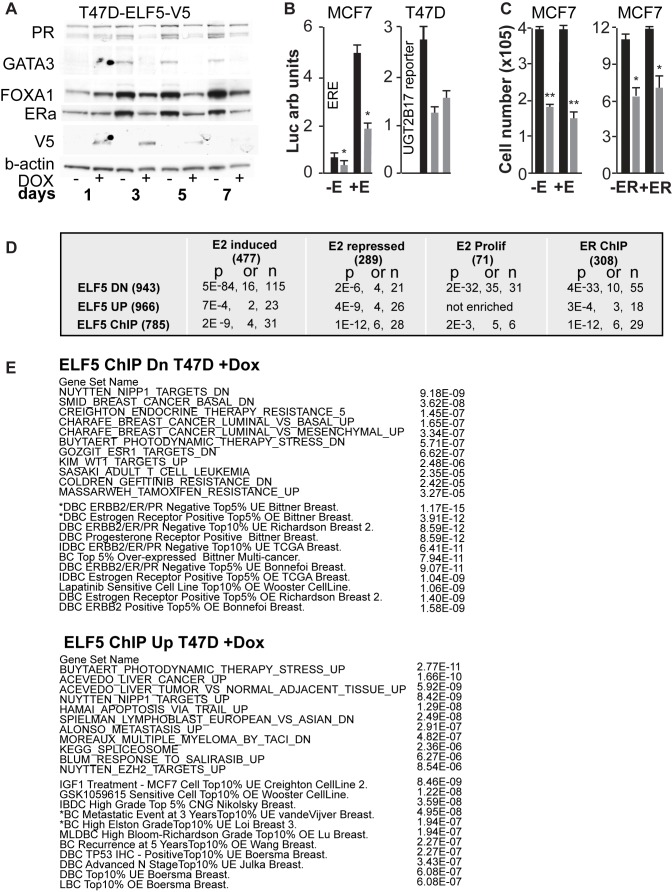
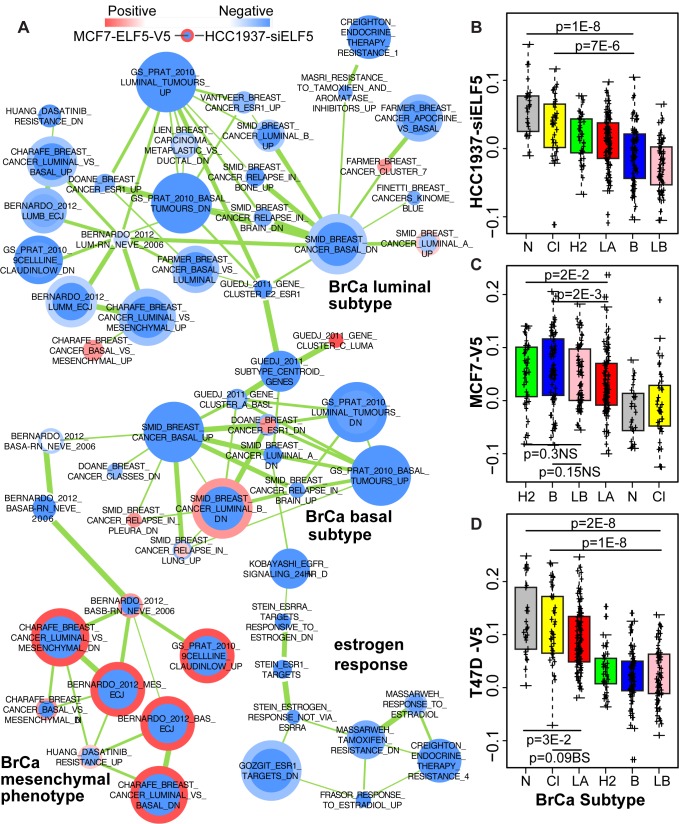
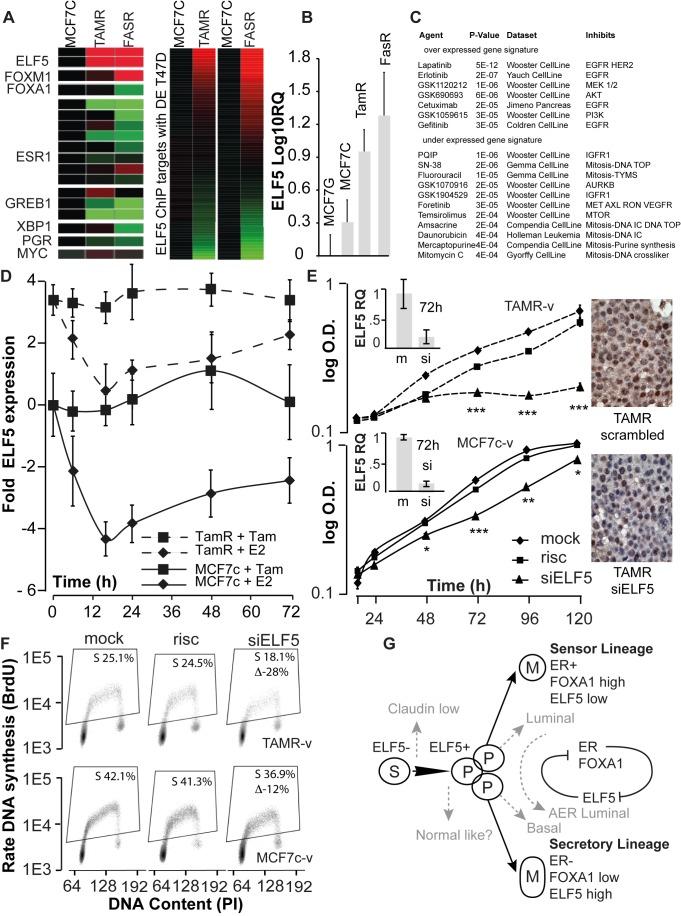
We have previously shown that during pregnancy the E-twenty-six (ETS) transcription factor ELF5 directs the differentiation of mammary progenitor cells toward the estrogen receptor (ER)-negative and milk producing cell lineage, raising the possibility that ELF5 may suppress the estrogen sensitivity of breast cancers. To test this we constructed inducible models of ELF5 expression in ER positive luminal breast cancer cells and interrogated them using transcript profiling and chromatin immunoprecipitation of DNA followed by DNA sequencing (ChIP-Seq). ELF5 suppressed ER and FOXA1 expression and broadly suppressed ER-driven patterns of gene expression including sets of genes distinguishing the luminal molecular subtype. Direct transcriptional targets of ELF5, which included FOXA1, EGFR, and MYC, accurately classified a large cohort of breast cancers into their intrinsic molecular subtypes, predicted ER status with high precision, and defined groups with differential prognosis. Knockdown of ELF5 in basal breast cancer cell lines suppressed basal patterns of gene expression and produced a shift in molecular subtype toward the claudin-low and normal-like groups. Luminal breast cancer cells that acquired resistance to the antiestrogen Tamoxifen showed greatly elevated levels of ELF5 and its transcriptional signature, and became dependent on ELF5 for proliferation, compared to the parental cells. Thus ELF5 provides a key transcriptional determinant of breast cancer molecular subtype by suppression of estrogen sensitivity in luminal breast cancer cells and promotion of basal characteristics in basal breast cancer cells, an action that may be utilised to acquire antiestrogen resistance.


Conflict of interest statement

The authors have declared that no competing interests exist.

Figures

Figure 1
Figure 1. ELF5 expression in normal breast and breast cancer.
ELF5 expression in the UNC337 breast cancer cohort according to subtype. Top panel shows combined results with statistical analysis (thick black line, median;, box, interquartile range 25%–75% of points; whiskers, 1.5× interquartile range; crosses, individual tumors). Bottom panel ELF5 expression in all individual tumor and normal samples. Basal and normal had significantly higher expression of ELF5.
Figure 2
Figure 2. Visualization of the transcriptional functions of ELF5 in breast cancer.
Affymetrix transcript profiling following induction of ELF5 in T47D and MCF7 luminal breast cancer cells, analysed by LIMMA and GSEA. Results are visualized using the enrichment map plug-in for Cytoscape. Each circular node is a gene set with diameter proportional to the number of genes. The outer node color represents the magnitude and direction of enrichment (see scale) in T47D cells, inner node color enrichment in MCF7 cells. Thickness of the edges (green lines) is proportional to the similarity of gene sets between linked nodes. The most related clusters are placed nearest to each other. The functions of prominent clusters are shown. The network can be examined in detail using the scalable PDF in Figure S4.
Figure 3
Figure 3. Chromatin immunoprecipitation and sequencing to identify genomic ELF5 binding sites.
(A) Conservative analysis of the ChIP-Seq identified 1,763 peaks of ELF5 interaction with the genome at 48 h of DOX treatment, with a smaller number seen at 24 h. Relationship between enrichment and distance from binding peak is shown. (B) relationship between change in gene expression with 48 h of DOX treatment and distance of a peak of ELF5 DNA binding from the TSS. Blue area defines the region of random chance computed by multiple random assignments of the ChIP data to gene expression. Red line shows the actual relationship between a peak's distance from the nearest gene's TSS and its change in expression in response to ELF5-V5 induction. (C) ELF5 binding within the indicated genomic regions. (D) The number of genomic transcription factor binding motifs (TRANSFAC) found in the ChIP fragments relative to their enrichment. (E) example of an enriched peak of ELF5-V5 binding to DNA (FOXA1 gene). (F) ChIP-qPCR validation of ELF5 binding sites to transcription factor gene promoters. I, IgG control antibody IP, E, ELF5 antibody IP, for the indicated PCR targets at 24 and 48 h; * significant (p<0.05) enrichment against input; # significant enrichment against RND3 control gene; Δ significant 24 h versus 48 h. (G) GSEA of curated functional sets among ELF5 ChIP targets.
Figure 4
Figure 4. Elf5 modulates cell adhesion and proliferation of breast cancer cells.
T47D (circles) and MCF7 (squares) cells were permanently transduced with DOX-inducible ELF5-V5 or empty retroviral vectors. Pooled cells were grown with puromycin. Representative experiments are shown. Bars, standard error of the mean (SEM). (A) Control cells transduced with empty vector grown in the absence of DOX (−D, open symbols) or presence of DOX from 0 h (+D0 h, closed symbols). (B) Cells transduced with the DOX-inducible ELF5-V5 expression vector grown in the presence of DOX (+D0 h, closed symbols) or absence of DOX (−D, open symbols). Inset Western blot of ELF5-V5 induction. (C) T47D-ELF5-V5 cells were grown as xenografts in nude mice, with (+D) or without (−D) DOX supplementation of food. Inset shows induction of ELF5-V5 expression. (D and E) Basal breast cancer cells HCC1937 (circles, dashed lines) or HCC1187 (squares, solid lines) were transfected with siRNA against ELF5 mRNA (siELF5, solid symbols), or were mock transfected (open symbols) before quantification of cell number with time. Insets, The degree of ELF5 mRNA knockdown was measured by qPCR at 72 h. (F) Cells were arrested at G1-S phase by treatment with hydroxyurea, then released. Histograms show the subsequent distribution of cells within the cell cycle phases by PI staining at the indicated times post release, green +DOX, red –DOX, and Western blots show the expression of key cell cycle regulatory proteins.
Figure 5
Figure 5. Elf5 modulates the adhesion of breast cancer cells.
(A) Quantification of detached cells in cultures treated with DOX (+D) compared to no induction (−D). (B) Ability of DOX-treated cells to replate 4 h after trypsin destruction of attachment proteins, compared to untreated cells. Data are expressed as a percentage of replated untreated cells. (C) Proportion of apoptotic cells in DOX treated (grey bars) compared to untreated (black bars) T47D-ELF5-V5 cells, measured by flow cytometry using the M30 antibody. (D) Expression and activation of key cell adhesion proteins following DOX induction of ELF5-V5 expression.
Figure 6
Figure 6. ELF5 suppresses the estrogen-sensitive phenotype.
(A) Western blot showing reduced expression of key genes involved in the response to estrogens following induction of ELF5 expression. (B) Reduced transcriptional activity of reporters of ER and FOXA1 (UGT2B17 promoter) transcriptional activity following induction of ELF5 in MCF7 cells. Black bars, -DOX, grey bars +DOX 72 h for ERE and 24 h and 48 h for FOXA1. (C) Cell accumulation in MCF7-V5 cell cultures with (+E) or without (−E) 10 nM estrogen treatment, or following expression of ER (+ER) and 10 nM E in the context of induced ELF5. Black bars, -DOX; grey bars +DOX, 72 h and 144 h, respectively. (D) interaction of ELF5-regulated gene sets with estrogen-regulated gene sets. p-Values and odds ratios derived from hypergeometric tests. Number of genes in brackets. (E) Enrichment of gene sets in ELF5 ChIP targets either down (Dn) or Up in response to forced ELF5-V5 expression in T47D cells with DOX. P-Values for hypergeometric tests from GSEA (upper case) or Oncomine (lower case).
Figure 7
Figure 7. ELF5 specifies breast cancer subtype.
(A) Sub network of breast cancer subtype gene sets derived from forced ELF5 expression in MCF7 luminal breast cancer cells (inner node color) and knockdown of ELF5 expression in HCC1937 basal breast cancer cells. Node size is proportional to gene set size; thicker green lines indicate greater gene set overlap. Nodes are positioned according to similarity in gene sets. Labels in bold type indicate the functional significance of the four clusters generated, label is plain type is the gene set name. The full network is shown in Figure S16. (B–D) expression signature analysis of the ELF5-induced changes in molecular subtype produced by ELF5 knockdown in HCC1937 cells (B), or forced ELF5 expression in MCF7 cells (C), or T47D cells (D). Bars show the indicated comparisons that produce the associated p-values. BS, borderline significance; NS, not significant.
Figure 8
Figure 8. Elevated ELF5 allows escape from antiestrogen-induced proliferative arrest.
(A) Affymetrix profiling of the expression (red high, green low) of key estrogen response genes in two models of antiestrogen resistance. The lines were derived from MCF7 cells from the Cardiff laboratory (MCF7C) to be resistant to TAMR or FASR. Additional two heat maps show the change in the expression of the ELF5 transcriptional signature in TAMR and FASR cells compared to parental. (B) PCR validation of the change in ELF5 expression in TAMR and FASR cells. (C) Drug-response signatures from Oncomine enriched among genes implicated in antiestrogen resistance that are ELF5 ChIP targets. (D) Eduction in ELF5 expression by estrogen treatment in MCF7C and TAMR cells. (E) Effects of ELF5 knockdown in TAMR cells on the expansion in cell number. Insets, demonstration of ELF5 knockdown by qPCR and IHC compared to both risc-free and scrambled siRNA controls. (F) BrdU labeling shows ELF5 knockdown inhibits cell proliferation in TAMR cells to a much greater extent than seen in the parental cells. (G) Model of ELF5 action in normal development and breast cancer, see the Discussion for details.

References

    1. Perou CM, Sorlie T, Eisen MB, van de Rijn M, Jeffrey SS, et al. (2000) Molecular portraits of human breast tumours. Nature 406: 747–752. - PubMed
    1. Andre F, Pusztai L (2006) Molecular classification of breast cancer: implications for selection of adjuvant chemotherapy. Nat Clin Pract Oncol 3: 621–632. - PubMed
    1. Hurtado A, Holmes KA, Ross-Innes CS, Schmidt D, Carroll JS (2011) FOXA1 is a key determinant of estrogen receptor function and endocrine response. Nat Genet 43: 27–33. - PMC - PubMed
    1. Lee H, Ormandy CJ (2012) Elf5, hormones and cell fate. Trends Endocrinol Metab in press. - PubMed
    1. Gutierrez-Hartmann A, Duval DL, Bradford AP (2007) ETS transcription factors in endocrine systems. Trends Endocrinol Metab 18: 150–158. - PubMed

Publication types

MeSH terms