

Chapter 9: Analyses using disease ontologies
- PMID: 23300417
- PMCID: PMC3531278
- DOI: 10.1371/journal.pcbi.1002827
Chapter 9: Analyses using disease ontologies
Abstract
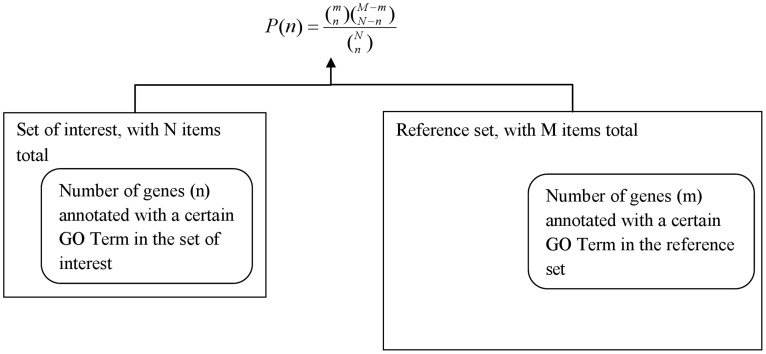
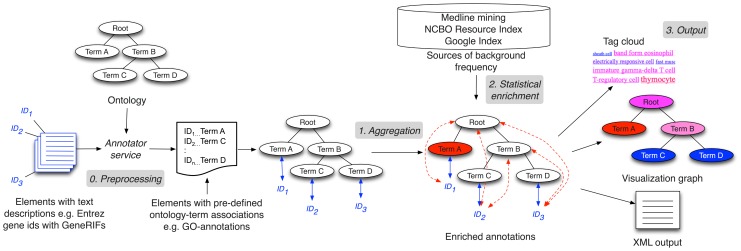
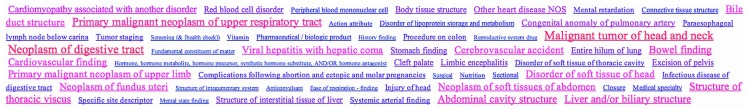
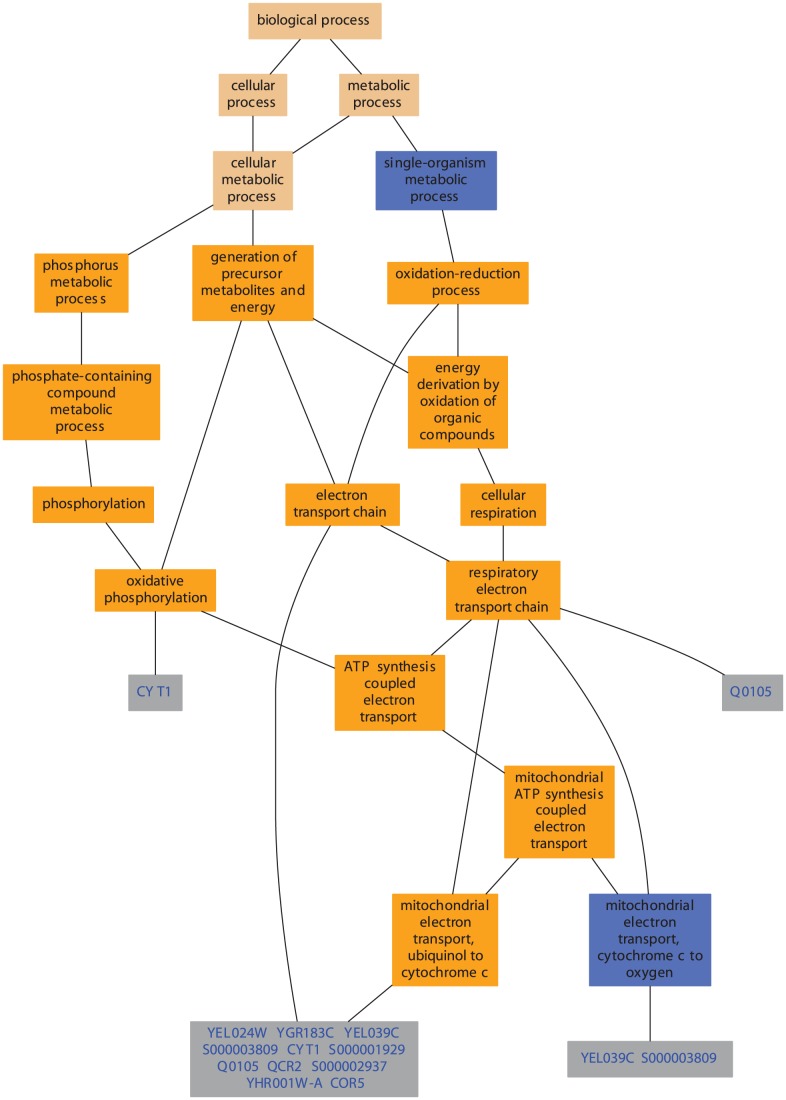
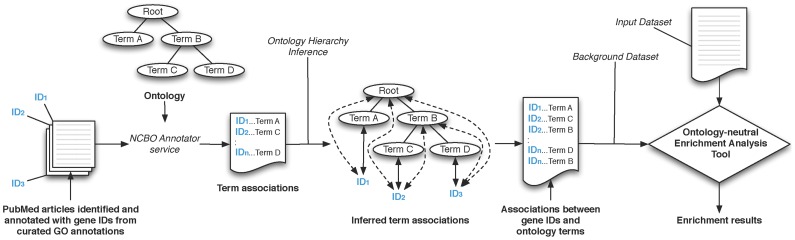
Advanced statistical methods used to analyze high-throughput data such as gene-expression assays result in long lists of "significant genes." One way to gain insight into the significance of altered expression levels is to determine whether Gene Ontology (GO) terms associated with a particular biological process, molecular function, or cellular component are over- or under-represented in the set of genes deemed significant. This process, referred to as enrichment analysis, profiles a gene-set, and is widely used to makes sense of the results of high-throughput experiments. The canonical example of enrichment analysis is when the output dataset is a list of genes differentially expressed in some condition. To determine the biological relevance of a lengthy gene list, the usual solution is to perform enrichment analysis with the GO. We can aggregate the annotating GO concepts for each gene in this list, and arrive at a profile of the biological processes or mechanisms affected by the condition under study. While GO has been the principal target for enrichment analysis, the methods of enrichment analysis are generalizable. We can conduct the same sort of profiling along other ontologies of interest. Just as scientists can ask "Which biological process is over-represented in my set of interesting genes or proteins?" we can also ask "Which disease (or class of diseases) is over-represented in my set of interesting genes or proteins?". For example, by annotating known protein mutations with disease terms from the ontologies in BioPortal, Mort et al. recently identified a class of diseases--blood coagulation disorders--that were associated with a 14-fold depletion in substitutions at O-linked glycosylation sites. With the availability of tools for automatic annotation of datasets with terms from disease ontologies, there is no reason to restrict enrichment analyses to the GO. In this chapter, we will discuss methods to perform enrichment analysis using any ontology available in the biomedical domain. We will review the general methodology of enrichment analysis, the associated challenges, and discuss the novel translational analyses enabled by the existence of public, national computational infrastructure and by the use of disease ontologies in such analyses.
Conflict of interest statement
The authors have declared that no competing interests exist.
Figures
References
-
- Altman RB, Raychaudhuri S (2001) Whole-genome expression analysis: challenges beyond clustering. Curr Opin Struct Biol 11: 340–347. - PubMed
-
- Brazma A, Vilo J (2000) Gene expression data analysis. FEBS Lett 480: 17–24. - PubMed
-
- Quackenbush J (2002) Microarray data normalization and transformation. Nat Genet 32 Suppl: 496–501. - PubMed
-
- Huttenhower C, Hibbs M, Myers C, Troyanskaya OG (2006) A scalable method for integration and functional analysis of multiple microarray datasets. Bioinformatics 22: 2890–2897. - PubMed
Publication types
MeSH terms
Grants and funding
LinkOut - more resources
Full Text Sources
