. 2013;9(1):e1002865.
doi: 10.1371/journal.pcbi.1002865. Epub 2013 Jan 3.

The underlying molecular and network level mechanisms in the evolution of robustness in gene regulatory networks

Affiliations

The underlying molecular and network level mechanisms in the evolution of robustness in gene regulatory networks

Mario Pujato et al. PLoS Comput Biol. 2013.

Abstract

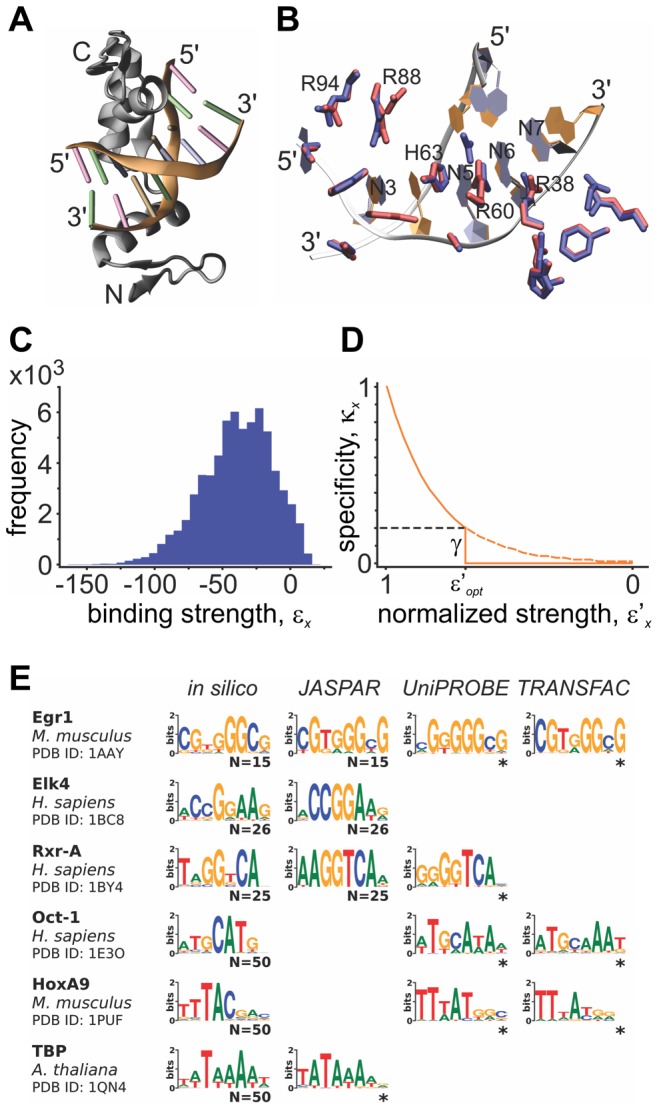
Gene regulatory networks show robustness to perturbations. Previous works identified robustness as an emergent property of gene network evolution but the underlying molecular mechanisms are poorly understood. We used a multi-tier modeling approach that integrates molecular sequence and structure information with network architecture and population dynamics. Structural models of transcription factor-DNA complexes are used to estimate relative binding specificities. In this model, mutations in the DNA cause changes on two levels: (a) at the sequence level in individual binding sites (modulating binding specificity), and (b) at the network level (creating and destroying binding sites). We used this model to dissect the underlying mechanisms responsible for the evolution of robustness in gene regulatory networks. Results suggest that in sparse architectures (represented by short promoters), a mixture of local-sequence and network-architecture level changes are exploited. At the local-sequence level, robustness evolves by decreasing the probabilities of both the destruction of existent and generation of new binding sites. Meanwhile, in highly interconnected architectures (represented by long promoters), robustness evolves almost entirely via network level changes, deleting and creating binding sites that modify the network architecture.


Conflict of interest statement

The authors have declared that no competing interests exist.

Figures

Figure 1
Figure 1. Determination of transcription factor binding sites and relative binding specificities by in-silico molecular modeling.
(A) Example of in-silico model of DNA-protein complex for the transcription factor EGR1 (PDB:1AAY, originally with sequence 5′-GCGTGGGC-3′) bound to the candidate 8-mer 5′-CGTTGTCG-3′. DNA color codes: GUA:green, CYT:pink, ADE:blue, THY:orange. (B) Detailed view of same model complex for protein residues at 3.5 Å distance from DNA, showing residue repositioning upon energy minimization procedure. Here, the crystal structure is shown in blue and the model in red. (C) Distribution of calculated binding strengths, ε, using the Robertson-Varani statistical potential on TF-DNA complexes for all possible 8-mers (48) for the Egr1 structure. (D) Transformation of normalized ε scores into relative binding specificities, κ. Dashed line indicates cutoff level γ, below which all specificities are set to zero, providing a variable separation between binding and non-binding 8-mers. ε′opt is a particular value of ε′, defining constant numbers of binding sites for each TF (see Materials and Methods). (E) Six in-silico determined TFBS preferences were compared against those available in JASPAR , UniProbe and TRANSFAC databases. N indicates the number of sequences used (we used the N lowest energy sequences to obtain in-silico preferences) to produce the information-content sequence logos (WebLogo [60]). *Logos constructed from frequency matrices.
Figure 2
Figure 2. Schematic representation of the gene-regulatory network model.
(A) Model of development. The expression of each gene is regulated by combinatorial interaction between an explicitly modeled cis-regulatory sequence (black lines) and the gene products (sequence specific transcription factors). Each gene product is represented by a different color. Shapes within the cis-regulatory regions represent sequence determinants of regulatory elements and their colors define the identity of the interacting transcription factor. Within the box, the explicit regulatory sequence representation is illustrated by showing an example of a consensus binding site for a given TF (maximal binding specificity, κmax) and a mutated site (with a lower κ). The extent of gene regulation is a function of the presence and associated binding specificities of each regulatory element (κix, where i is the input gene and x is a regulatory site on gene j), transcription factor abundances (si) and the function of the interacting transcription factors (activator or repressor of transcription, represented as positive and negative si values). (B) Population model. Simulations start with a randomly chosen developmentally stable founder. Variation is introduced in two forms: exchange of promoter regions between two randomly chosen parents (without recombination within promoter regions) and single point mutations at the DNA level. Selective pressure is applied to the offspring on two levels: they must develop a stable expression pattern through time (phenotype) and that phenotype must be similar to that of the founder.
Figure 3
Figure 3. Evolution of robustness depends on URR length and specificity gap.
(A) Change in robustness, measured as the difference of the mean phenotypic distances between unperturbed and perturbed individuals at generations 2000 and 0. The mutation rate used for this measure was 1 mutation per 100 bp per genome. (B) Change in connectivity (comparing generation 2000 to generation 0), measured by the fraction of unique inputs in the network of a given individual. The numbers at the end of each bar represent the connectivity at the end of the simulations. Error bars are the standard error of the mean over 100 independent simulations.
Figure 4
Figure 4. Classification of events produced by single point mutations on a cis-regulatory segment.
(A) Decision tree defining all possible events on cis-regulatory regions after the introduction of a point mutation. (B) These events can be thought of as “tools” available to the system, since they summarize all the changes the system can potentially make. For clarity, we also classified them in a continuum, according to their impact on the network architecture. Silent mutations are located at the local-sequence level extreme, since they produce changes that only affect the sequence without modifying either network architecture or gene expression levels. On the other hand, deletion or creation of unique TFBSs is found at the other extreme (network-architecture level) because these events directly impact the network's architecture. A preserved TFBS has the ability to change the relative specificity of a binding site.
Figure 5
Figure 5. Decomposition of robustness.
Robustness due to stable individuals is the sum of the products between the frequency and the average phenotypic distance of the mutational events described in Fig. 4A. Therefore they can be used to decompose robustness. (A) Relative composition of the frequencies of each mutation type. They were measured as the differences between final and initial generations in the simulations for each of the classified mutational events (see Materials and Methods). Silent mutations dominate in almost all cases, especially at low specificity gap (γ) and URR lengths (L). Silent mutations are found at the extreme of local-sequence level changes (Fig. 4B). (B) Fraction of local-sequence and network-architecture level changes. Local changes were calculated as the fraction of the total robustness change assuming constant frequency of silent mutations (see Materials and Methods). The length of the URRs (in base pairs) is indicated on top of each bar in both graphs.
Figure 6
Figure 6. Local-sequence level mechanisms.
(A) Resistance to creation of TFBSs within TFBS-free regions, measured as the frequency of silent mutation events (Fig. 4) normalized to the fraction of TFBS-free region in the genome. (B) TFBS conservation or degree of resilience to deletion of TFBSs, measured as the average probability that a TFBS will remain a TFBS following a point mutation. Error bars are computed as the standard error of the mean over 100 independent simulations.
Figure 7
Figure 7. Network-architecture level mechanisms.
Correlation between the “other contributions” portion of the change in robustness (Fig. 5B) and the average network rewiring as a function of URR (L) and specificity gap (γ). Rewiring, Φ, was computed between individuals at generation 2000 and their respective founders (see Materials and Methods). These values were corrected for the effects of changing connectivity by calculating Φ between two randomly chosen stable individuals, both with the same average connectivity values observed for the individuals at the end of the simulations. The correlation shows that Φ explains for the most part the “other contributions” component of robustness. The amount of rewiring depends primarily on L and to a lesser extent on γ. Error bars are the standard error of the mean over 100 independent simulations.

References

    1. Masel J, Siegal M (2009) Robustness: mechanisms and consequences. Trends Genet 25: 395–403. - PMC - PubMed
    1. Price N, Cartwright RA, Sabath N, Graur D, Azevedo RB (2011) Neutral evolution of robustness in Drosophila microRNA precursors. Mol Biol Evol 28: 2115–2123. - PMC - PubMed
    1. Matias Rodrigues J, Wagner A (2009) Evolutionary plasticity and innovations in complex metabolic reaction networks. PLoS Comput Biol 5: e1000613. - PMC - PubMed
    1. Isalan M, Lemerle C, Michalodimitrakis K, Horn C, Beltrao P, et al. (2008) Evolvability and hierarchy in rewired bacterial gene networks. Nature 452: 840–845. - PMC - PubMed
    1. Masel J, Trotter M (2010) Robustness and Evolvability. Trends Genet 26: 406–14. - PMC - PubMed

Publication types

LinkOut - more resources