. 2012 Dec;8(12):e1003103.
doi: 10.1371/journal.ppat.1003103. Epub 2012 Dec 27.

p12 tethers the murine leukemia virus pre-integration complex to mitotic chromosomes

Affiliations

p12 tethers the murine leukemia virus pre-integration complex to mitotic chromosomes

Efrat Elis et al. PLoS Pathog. 2012 Dec.

Abstract

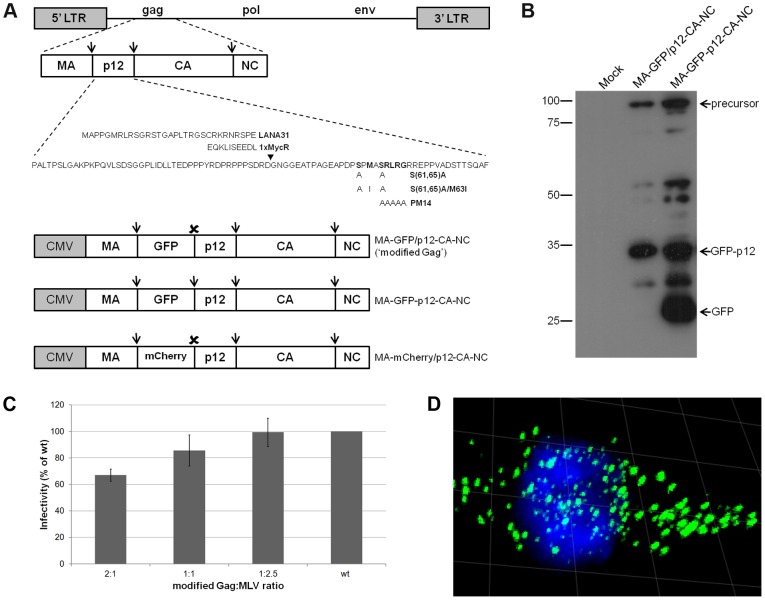
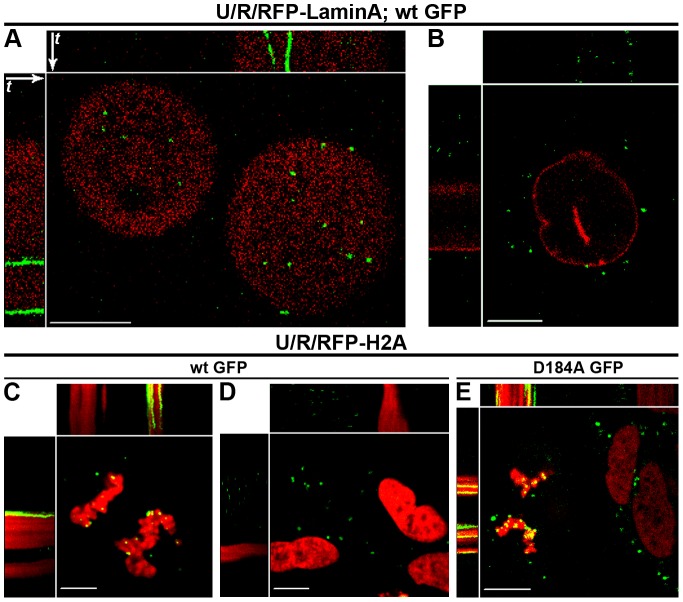
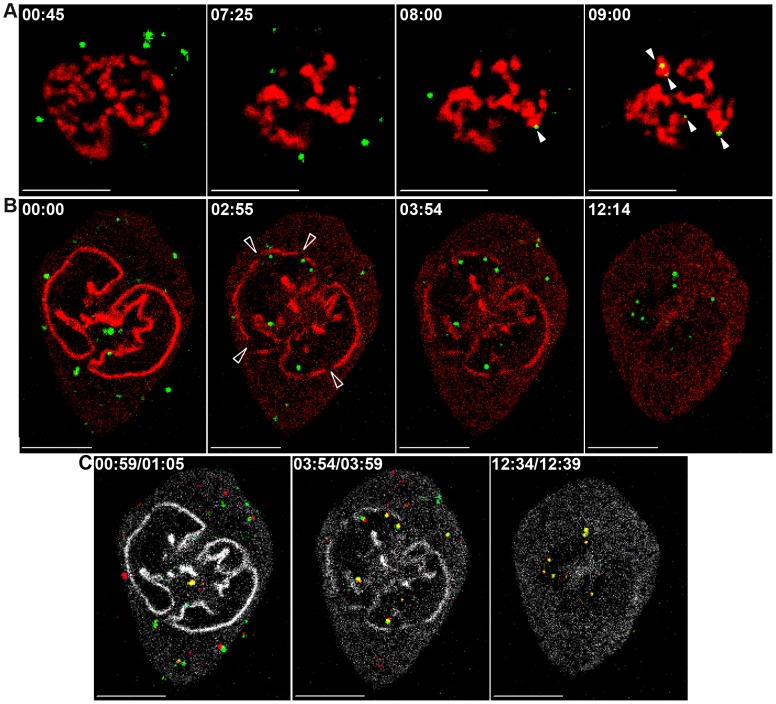
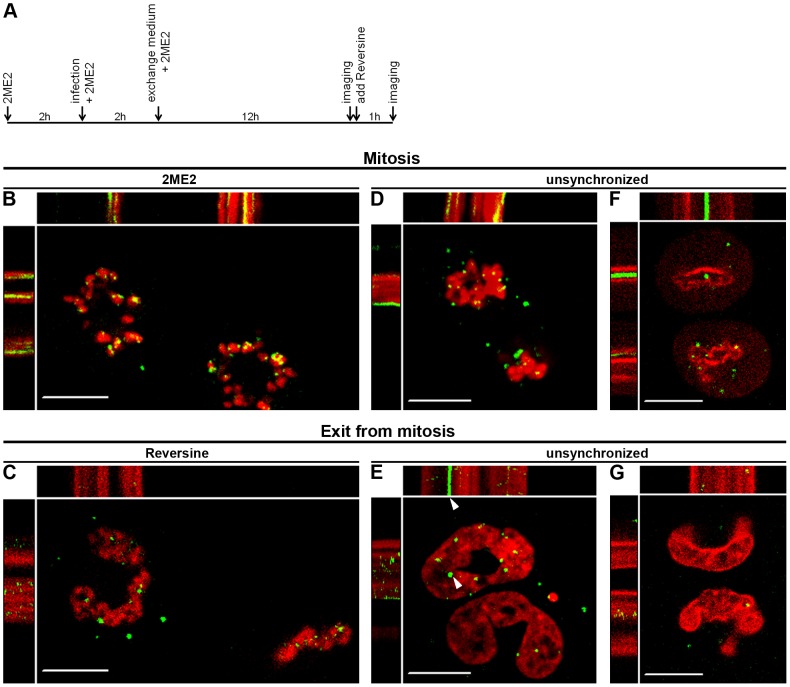
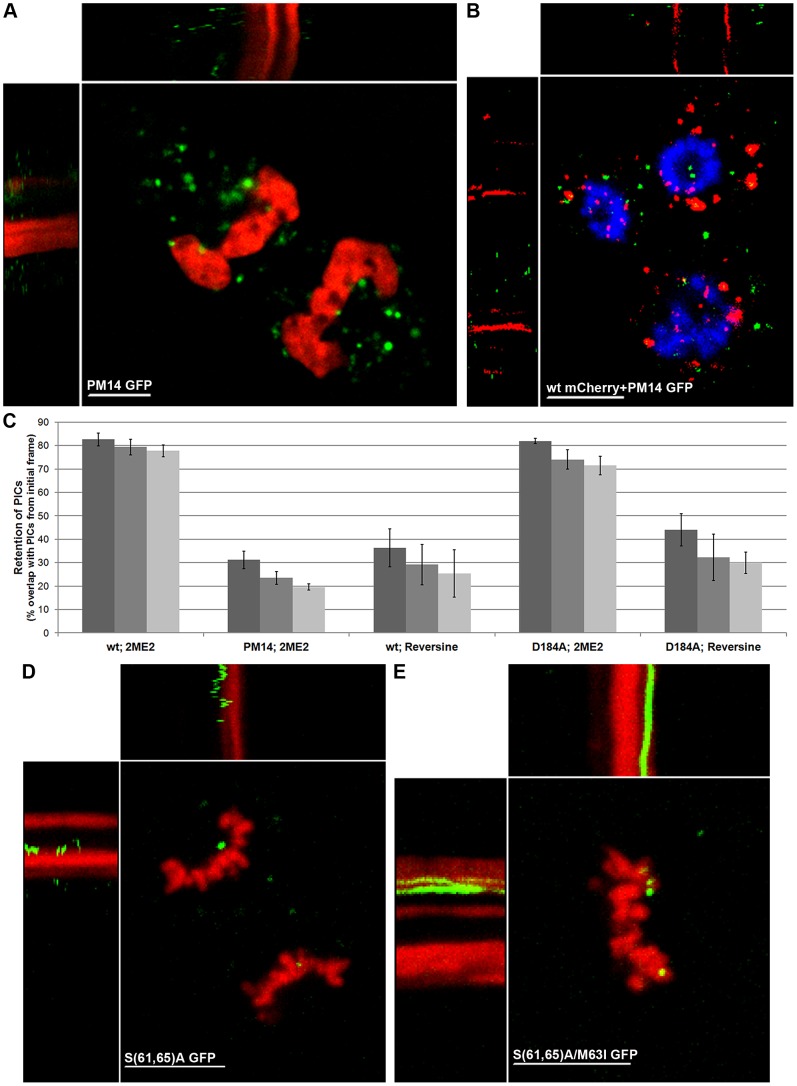
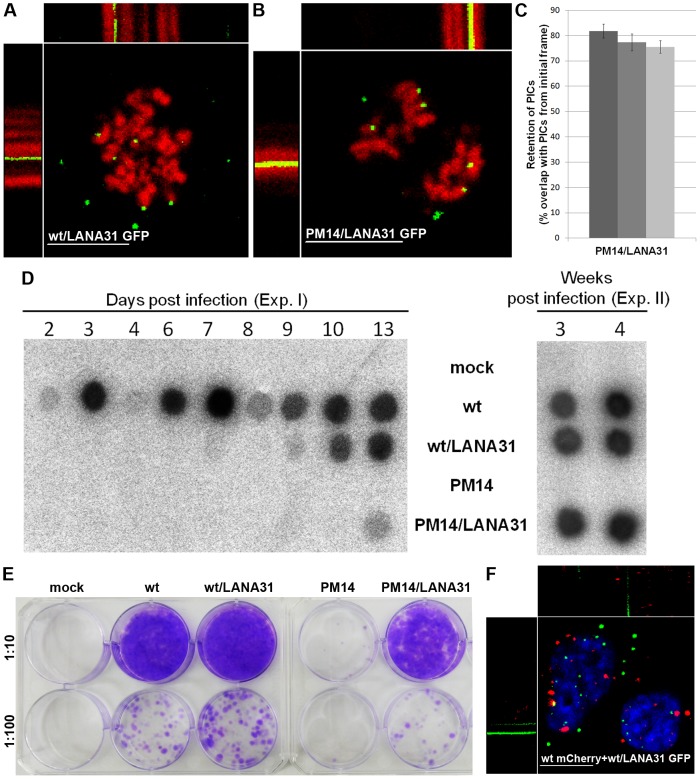
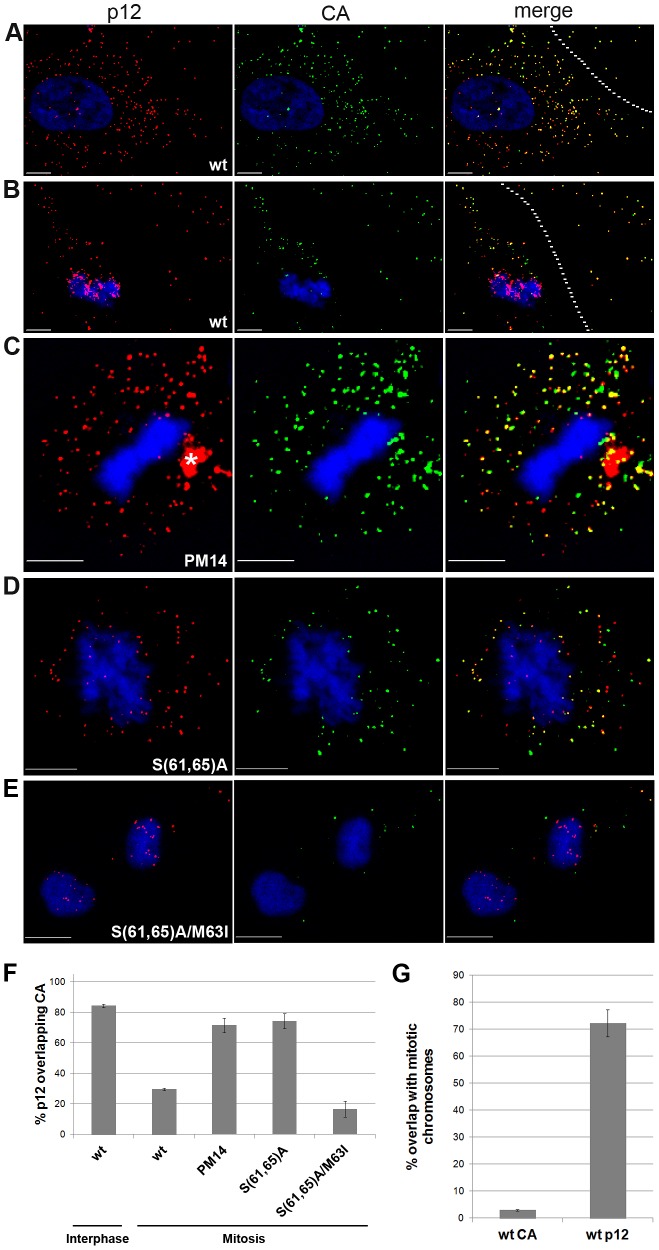
The p12 protein of the murine leukemia virus (MLV) is a constituent of the pre-integration complex (PIC) but its function in this complex remains unknown. We developed an imaging system to monitor MLV PIC trafficking in live cells. This allowed the visualization of PIC docking to mitotic chromosomes and its release upon exit from mitosis. Docking occurred concomitantly with nuclear envelope breakdown and was impaired for PICs of viruses with lethal p12 mutations. Insertion of a heterologous chromatin binding module into p12 of one of these mutants restored PICs attachment to the chromosomes and partially rescued virus replication. Capsid dissociated from wild type PICs in mitotic cells but remained associated with PICs harboring tethering-negative p12 mutants. Altogether, these results explain, in part, MLV restriction to dividing cells and reveal a role for p12 as a factor that tethers MLV PIC to mitotic chromosomes.


Conflict of interest statement

The authors have declared that no competing interests exist.

Figures

Figure 1
Figure 1. Characteristics of real time imaging system for MLV PICs.
(A) Schematics of MLV genome, Gag, modified Gags, p12 and mutations. Mutated residues are aligned with the cognate wt residues (in bold). Arrowhead marks LANA31 and Myc epitope insertion site. Arrows and ✗ represent protease-cleavage sites and protease-resistant linker (GGSI), respectively. (B) Western blot of chimeric virions. Anti-GFP antibody was used to detect the processing of GFP fusion proteins in virion pellets, purified from supernatants of cultures, transfected with the indicated modified Gags and wt MLV. Mock represents transfection with no plasmid DNA. (C) Infectivity of chimeric virions. The indicated molar ratios of MA-GFP/p12-CA-NC and wt MLV plasmids were co-transfected into 293T cells, together with pQCXIP-GFP-C1 vector. Virions in culture supernatants, normalized by RT activity, were used to infect NIH3T3 cells, which were analyzed by FACS for GFP fluorescence, 2 days post-infection. Average infectivity from 3 independent experiments is presented as percentage of infectivity of wt particles with no modified Gag (wt). Error bars indicate SEM. (D) Confocal fluorescence microscopy of wt GFP-infected U/R cell. Serial optical sections were reconstituted into a 3D image, with a 10 µm grid. PICs are in green and Hoechst-stained chromosomes in blue.
Figure 2
Figure 2. MLV PICs dock to mitotic chromosomes independently of IN activity.
U/R/RFP-laminA (A, B) and U/R/RFP-H2A (C–E) cells were infected with wt GFP (A–D), or with D184A GFP (E) virions. Shown are representing kymographs (A–E) of cells imaged in Movie S2. White arrows (shown only in A but apply to all kymographs of all figures) represent the order of the movie frames over time (t); where t = 30, 47, 152, 150 and 26 seconds for A, B, C, D and E, respectively. In kymographs, immobile PICs appear as continues green lines (A, C, E); in contrast, motile PICs change x, y coordinates over time, resulting in the scattered/dotted pattern (B, D). Bars represent 10 µm.
Figure 3
Figure 3. Docking onto mitotic chromosomes coincides with NE breakdown.
wt GFP-infected U/R/RFP-H2A (A) and U/R/RFP-laminA (B, C) cells, were imaged upon entry to mitosis. Shown are frames from the resulting movies (Movie S3; parts A and B). Full arrowheads (A) mark PICs (green) anchored to the mitotic chromosomes (red). Empty arrowheads (B) mark gaps in the NE (red). (C) Visualization of PICs' movement during NE breakdown. Three pairs of frames were chosen from the start, middle and end of Movie S3, part B. For each pair, the PICs in the second frame were superimposed on the first frame and pseudo-colored with red. Lamin A signal was pseudo-colored with white. PICs with a relative large shift in their position appear in red or green while PICs with a minimal shift appear in yellow. Time (minutes and seconds) from start of imaging is shown for each frame. Bars represent 10 µm.
Figure 4
Figure 4. Release of PICs from chromosomes upon exit from mitosis.
(A) Timeline of 2ME2 and Reversine treatments. Reversine was added immediately after completion of the first imaging session. (B–G) Representing kymographs of wt GFP-infected cells (Movie S4), imaged for 16 (B, C) or ∼30 (D–G) seconds. The same cells were imaged at mitosis and exit from mitosis. (B, C) U/R/RFP-H2A cells, treated as in (A). (D, E) Infected, unsynchronized U/R/RFP-H2A, or (F, G) U/R/RFP-laminA, cells at mitosis (D, F) and exit of mitosis (E, G). The cells in E and G were imaged ∼4 and 1 hr, respectively, after their initial imaging. Arrowheads mark a PIC that remained associated with the chromosome. Bars represent 10 µm.
Figure 5
Figure 5. Failure of p12 mutants to dock to mitotic chromosomes.
(A, B, D and E) Representing kymographs of unsynchronized, mitotic U/R/RFP-H2A (A, C and D) or 2ME2-arrested U/R (B) cells infected with PM14 GFP (A), PM14 GFP and wt mCherry (B), S(61,65)A GFP (D), S(61,65)A/M63I GFP (E) shown in Movie S5. Hoechst-stained chromosomes are in blue (B). t = 134, 74, 48 and 48 seconds for A, B, D and E, respectively. Bars represent 10 µm. (C) Quantification of spatial retention of PICs over time. The percentages of overlap between PICs in the first frame and PICs in the second, third and fourth frames (dark, intermediate and lighter bars, respectively) was calculated for wt GFP (wt), PM14 GFP (PM14) and D184A GFP (D184A) -infected cells, treated with the indicated drug. All the PICs in the above frames were identified through intensity-based segmentation (Materials and Methods), and analyzed with no selection for specific PICs. Shown are the average values obtained from 6 (wt; 2ME2), 8 (PM14; 2ME2), 4 (wt; Reversine), 7 (D184A; 2ME2) and 4 (D184A; Reversine) inspected cells, each with approximately 30 PICs, taken from 4, 4, 3, 4 and 2 movies, respectively. For all treatments, the time between frames ranged from 0.6 to 0.9 seconds. Error bars indicate SEM. Bars represent 10 µm.
Figure 6
Figure 6. LANA31 insertion into p12 of PM14 virus rescues PIC docking to chromosomes and viral replication.
Representing kymographs from Movie S6 of unsynchronized, mitotic U/R/RFP-H2A (A, B) or U/R cells that exit mitosis (F), infected with wt/LANA31 GFP (A), PM14/LANA31 GFP (B), or wt mCherry together with wt/LANA31 GFP (F). Hoechst-stained chromosomes are in blue (F). t = 24, 24 and 72 seconds for A, B and F, respectively. Bars represent 10 µm. (C) Quantification of spatial retention of PICs over time. Retention of PM14/LANA31 GFP was calculated as described for Fig. 5C. Shown are the average values obtained from four cells, each from an independent movie, and each with approximately 20 PICs. Error bars indicate SEM. (D) Virus spreading. NIH3T3 cells were infected with the indicated viruses, normalized by RT activity. Samples of culture supernatants were harvested at the indicated time points and assayed for RT activity to detect virus spreading. Mock represents uninfected cells. Shown are results of two experiments (Exp. I and II). (E) Single-cycle infection assay. VLPs, harboring the indicated modifications, and normalized by exogenous RT assay, were used to transduce the pQCXIN vector into NIH3T3 cells. 2 dpi the cells were diluted (1∶10 and 1∶100) and selected in G418 medium for additional 10 days. G418-resistant colonies were fixed and stained with crystal violet. Shown is one of three independent experiments.
Figure 7
Figure 7. CA-p12 dissociation in mitotic cells: discrepancy between wt and p12 mutants.
Immunofluorescence of interphase (A) and mitotic (B–E) U/R cells, infected with 1xMycR (A, B), or with 1xMycR clones carrying PM14 (C), S(61,65)A (D) and S(61,65)A/M63I (E) mutations. 12 hpi cells were stained with anti-CA (green) and anti-Myc (red) antibodies. Chromosomes were stained with DAPI (blue). Extracellular virions are to the right of the dashed lines (A, B). An asterisk (C) marks non-typical p12 staining. (F) Quantification of the percentage of p12 signal that overlaps CA signal in interphase and mitotic cells (∼400 p12 dots/cell were analyzed in 4 and 3 1xMycR-infected mitotic and interphase cells, respectively; ∼40–130 dots/cell in 5 cells were analyzed for the rest of the viruses). (G) Quantification of the percentage of p12 and CA signals that overlap the DAPI-stained chromatin in 1xMycR-infected mitotic cells. Error bars indicate standard error of the mean (SEM). Bars represent 10 µm.

References

    1. Hatziioannou T, Goff SP (2001) Infection of nondividing cells by Rous sarcoma virus. J Virol 75: 9526–9531. - PMC - PubMed
    1. Lewis PF, Emerman M (1994) Passage through mitosis is required for oncoretroviruses but not for the human immunodeficiency virus. J Virol 68: 510–516. - PMC - PubMed
    1. Roe T, Reynolds TC, Yu G, Brown PO (1993) Integration of murine leukemia virus DNA depends on mitosis. EMBO J 12: 2099–2108. - PMC - PubMed
    1. Suzuki Y, Craigie R (2007) The road to chromatin - nuclear entry of retroviruses. Nat Rev Microbiol 5: 187–196. - PubMed
    1. Bowerman B, Brown PO, Bishop JM, Varmus HE (1989) A nucleoprotein complex mediates the integration of retroviral DNA. Genes Dev 3: 469–478. - PubMed

Publication types