. 2012;7(12):e51361.
doi: 10.1371/journal.pone.0051361. Epub 2012 Dec 27.

Lineage tracing of Pf4-Cre marks hematopoietic stem cells and their progeny

Affiliations

Lineage tracing of Pf4-Cre marks hematopoietic stem cells and their progeny

Simon D J Calaminus et al. PLoS One. 2012.

Erratum in

  • PLoS One. 2013;8(5). doi:10.1371/annotation/4c610387-c7f0-4330-b772-30ed52a07547. Guitart, Amelie [corrected to Guitart, Amelie V]

Abstract

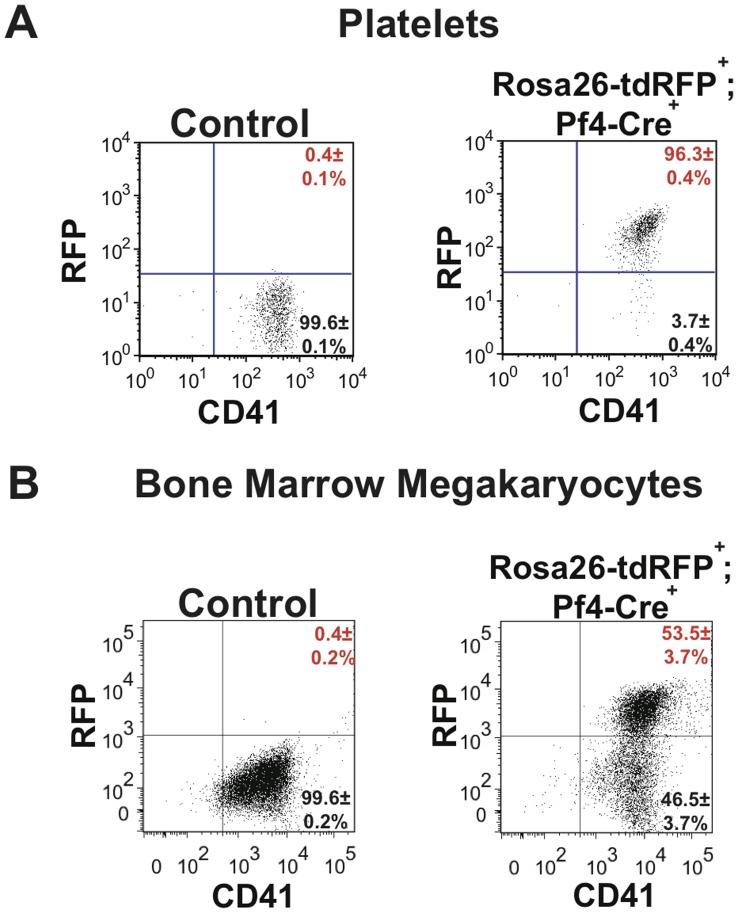
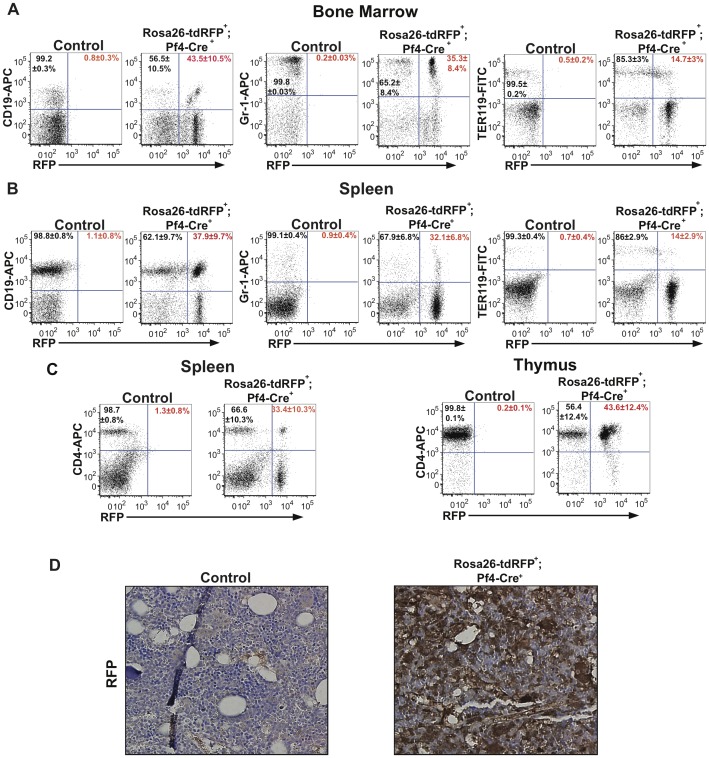
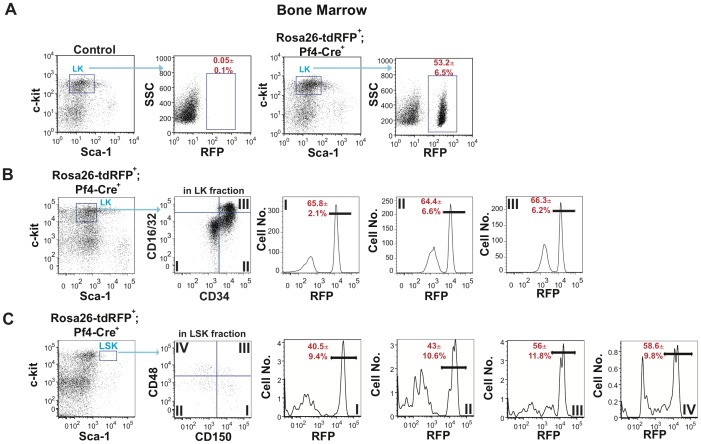
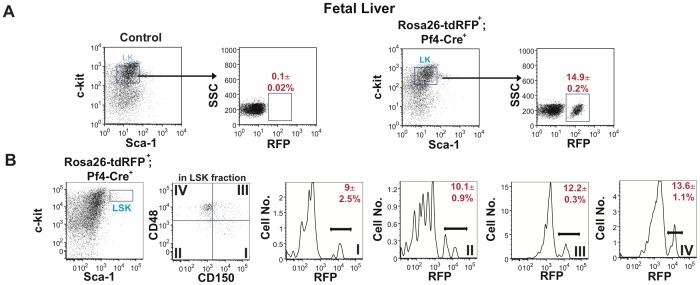
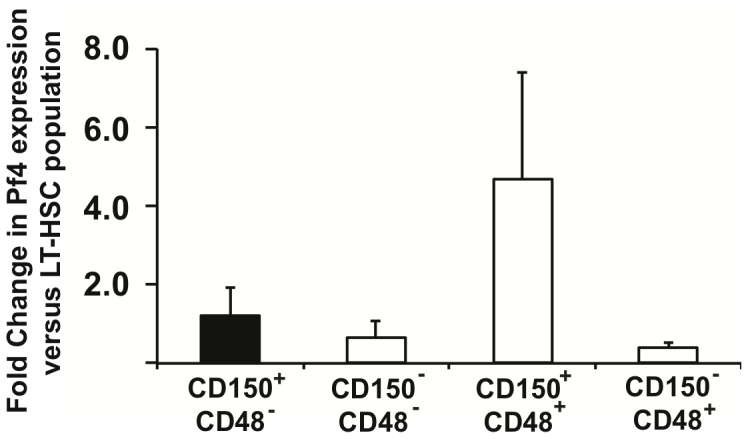
The development of a megakaryocyte lineage specific Cre deleter, using the Pf4 (CXCL4) promoter (Pf4-Cre), was a significant step forward in the specific analysis of platelet and megakaryocyte cell biology. However, in the present study we have employed a sensitive reporter-based approach to demonstrate that Pf4-Cre also recombines in a significant proportion of both fetal liver and bone marrow hematopoietic stem cells (HSCs), including the most primitive fraction containing the long-term repopulating HSCs. Consequently, we demonstrate that Pf4-Cre activity is not megakaryocyte lineage-specific but extends to other myeloid and lymphoid lineages at significant levels between 15-60%. Finally, we show for the first time that Pf4 transcripts are present in adult HSCs and primitive hematopoietic progenitor cells. These results have fundamental implications for the use of the Pf4-Cre mouse model and for our understanding of a possible role for Pf4 in the development of the hematopoietic lineage.


Conflict of interest statement

Competing Interests: The authors have declared that no competing interests exist.

Figures

Figure 1
Figure 1. Pf4-Cre efficiently excises floxed sequences in megakaryocytes and platelets.
(A) Platelets from both Rosa26-tdRFP+;Pf4-Cre litter matched control and Rosa26-tdRFP+;Pf4-Cre+ mice were isolated from whole blood before being stained with anti-CD41-FITC antibody. The level of RFP expression in the platelet (CD41+) population was identified. (B) Bone marrow megakaryocytes were isolated before being stained with anti-CD41-FITC antibody. Megakaryocytes were identified using FSC vs SSC gating and the levels of RFP expression in the megakaryocyte population was determined. Dot plots are representative figures of three independent experiments with the mean±standard error of the mean (SEM).
Figure 2
Figure 2. Pf4-Cre activates RFP expression in all hematopoietic lineages.
(A) Frequencies of RFP-expressing B-lymphoid (CD19+), myeloid (Gr-1+), and erythroid (Ter119+) cells in the bone marrow obtained from adult Rosa26-tdRFP+;Pf4-Cre+ mice and Rosa26-tdRFP+;Pf4-Cre litter matched controls. (B) Frequencies of RFP-expressing B-lymphoid (CD19+), myeloid (Gr-1+), and erythroid (Ter119+) cells in the spleen from adult Rosa26-tdRFP+;Pf4-Cre+ mice and Rosa26-tdRFP+;Pf4-Cre litter matched controls. (C) Frequencies of RFP-expressing CD4+ T cells in the spleen and thymus of adult Rosa26-tdRFP+;Pf4-Cre+ mice and Rosa26-tdRFP+;Pf4-Cre litter matched controls. Dot plots shown in Figure 1A–C are representative figures of 3–5 independent experiments with values shown as an average±SEM from 3–5 independent experiments. % of RFP+ cells is indicated in red and % of RFP in black. (D) Bone marrow from Rosa26-tdRFP+;Pf4-Cre+ and litter matched controls was fixed, and histologically stained for RFP. Images are representative of 2 independent experiments.
Figure 3
Figure 3. Pf4-Cre genetically marks the adult stem cell and early progenitor cell compartment.
Bone marrow from Rosa26-tdRFP+;Pf4-Cre+ and litter matched control mice was isolated and (A) the Sca-1c-kit+ cells identified in the Lin cell compartment. LK compartment was subfractionated using side scatter (SSC) and RFP expression to identify the total number of RFP (black) and RFP+ (red) cells. (B) The LK population was subfractionated using CD34 and CD16/32 to identify RFP+ (red) cells in the megakaryocyte-erythrocyte progenitor (MEP) (Compartment I), common myeloid progenitor (CMP) (Compartment II) and granulocyte-macrophage progenitor (GMP) (Compartment III) cell populations. (C) RFP expression in HSCs and primitive progenitors in the LSK compartment. The LSK cell compartment was subfractionated using CD48 and CD150 to identify the frequencies of RFP+ (red) cells in LSK CD150+CD48 HSC (Compartment I), LSK CD150CD48 (Compartment II), LSK CD150+CD48+ (Compartment III) and LSK CD150CD48+ (Compartment IV) compartments. Dot plots and histograms are representative figures of three independent experiments with the mean±SEM from three independent experiments.
Figure 4
Figure 4. Primitive fetal liver cells from Rosa26-tdRFP+;Pf4-Cre+ mice express RFP.
Fetal liver from day E14.5 Rosa26-tdRFP+;Pf4-Cre+ and litter matched controls was isolated and (A) the Sca-1c-kit+ cells identified in the Lin cell compartment. LK compartment was subfractionated using side scatter (SSC) and RFP expression to identify the total number of RFP (black) and RFP+ (red) cells. Dot plots are representative figures of three independent experiments with the average±SEM from three independent experiments. (B) RFP expression in HSCs and primitive progenitors within the LSK compartment. The LSK cell compartment was subfractionated using CD48 and CD150 to identify the frequencies of RFP+ (red) in LSK CD150+CD48 HSC (Compartment I), LSK CD150CD48 (Compartment II), LSK CD150+CD48+ (Compartment III) and LSK CD150CD48+ (Compartment IV) compartments. Dot plots and histograms are representative figures of three independent experiments with the mean±SEM from three independent experiments.
Figure 5
Figure 5. Pf4 gene expression is identified in Stem and primitive progenitor cell populations.
Pf4 expression in LSK CD150+CD48 HSCs, LSK CD150CD48, LSK CD150+CD48+, and LSK CD150CD48+ cells sorted from bone marrow of control mice. Relative Pf4 expression levels were calculated with the LT-HSC fraction set to the value of 1 (see methods). Results are mean±SD from three independent experiments.

References

    1. Bockamp E, Sprengel R, Eshkind L, Lehmann T, Braun JM, et al. (2008) Conditional transgenic mouse models: from the basics to genome-wide sets of knockouts and current studies of tissue regeneration. Regenerative medicine 3: 217–235. - PubMed
    1. de Boer J, Williams A, Skavdis G, Harker N, Coles M, et al. (2003) Transgenic mice with hematopoietic and lymphoid specific expression of Cre. European journal of immunology 33: 314–325. - PubMed
    1. Matthaei KI (2007) Genetically manipulated mice: a powerful tool with unsuspected caveats. The Journal of physiology 582: 481–488. - PMC - PubMed
    1. Speck NA, Iruela-Arispe ML (2009) Conditional Cre/LoxP strategies for the study of hematopoietic stem cell formation. Blood cells, molecules & diseases 43: 6–11. - PMC - PubMed
    1. Hayashi S, McMahon AP (2002) Efficient recombination in diverse tissues by a tamoxifen-inducible form of Cre: a tool for temporally regulated gene activation/inactivation in the mouse. Developmental biology 244: 305–318. - PubMed

Publication types

MeSH terms