. 2012;7(12):e52260.
doi: 10.1371/journal.pone.0052260. Epub 2012 Dec 26.

Powerful identification of cis-regulatory SNPs in human primary monocytes using allele-specific gene expression

Affiliations

Powerful identification of cis-regulatory SNPs in human primary monocytes using allele-specific gene expression

Jonas Carlsson Almlöf et al. PLoS One. 2012.

Abstract

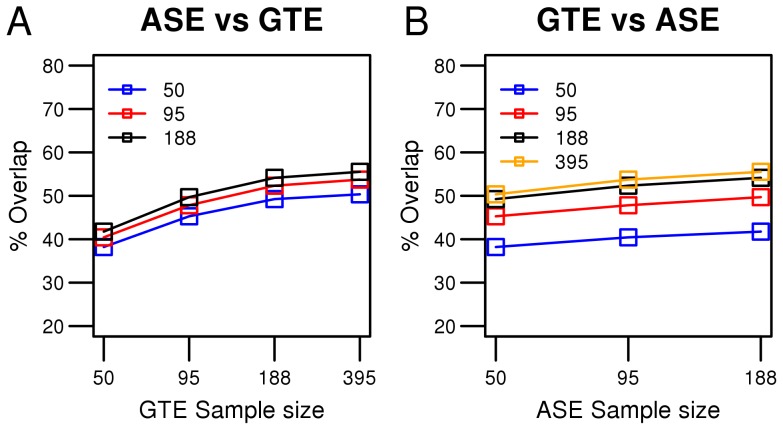
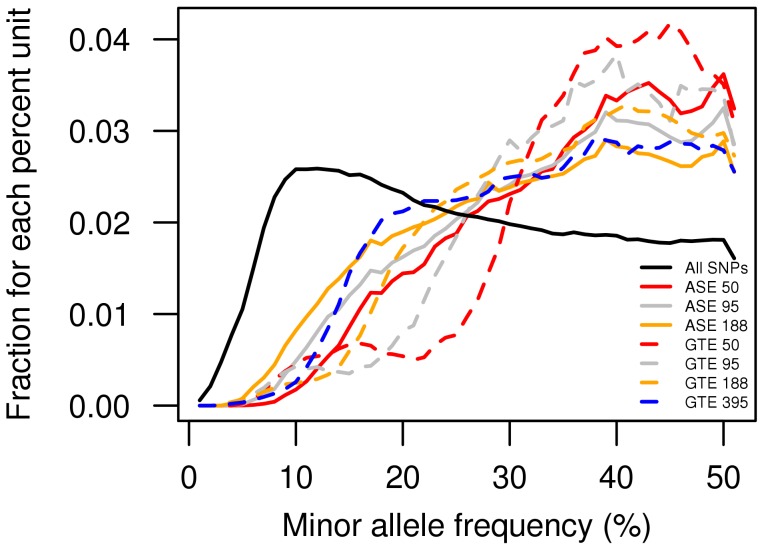
A large number of genome-wide association studies have been performed during the past five years to identify associations between SNPs and human complex diseases and traits. The assignment of a functional role for the identified disease-associated SNP is not straight-forward. Genome-wide expression quantitative trait locus (eQTL) analysis is frequently used as the initial step to define a function while allele-specific gene expression (ASE) analysis has not yet gained a wide-spread use in disease mapping studies. We compared the power to identify cis-acting regulatory SNPs (cis-rSNPs) by genome-wide allele-specific gene expression (ASE) analysis with that of traditional expression quantitative trait locus (eQTL) mapping. Our study included 395 healthy blood donors for whom global gene expression profiles in circulating monocytes were determined by Illumina BeadArrays. ASE was assessed in a subset of these monocytes from 188 donors by quantitative genotyping of mRNA using a genome-wide panel of SNP markers. The performance of the two methods for detecting cis-rSNPs was evaluated by comparing associations between SNP genotypes and gene expression levels in sample sets of varying size. We found that up to 8-fold more samples are required for eQTL mapping to reach the same statistical power as that obtained by ASE analysis for the same rSNPs. The performance of ASE is insensitive to SNPs with low minor allele frequencies and detects a larger number of significantly associated rSNPs using the same sample size as eQTL mapping. An unequivocal conclusion from our comparison is that ASE analysis is more sensitive for detecting cis-rSNPs than standard eQTL mapping. Our study shows the potential of ASE mapping in tissue samples and primary cells which are difficult to obtain in large numbers.


Conflict of interest statement

Competing Interests: The authors have declared that no competing interests exist.

Figures

Figure 1
Figure 1. Overlap of significantly associated rSNPs identified by ASE and GTE.
The percentage of overlapping rSNPs detected by allele-specific expression (ASE) and genotype expression (GTE) analysis is plotted for varying numbers of samples. The top 9536 SNPs from the GTE analysis are compared with the top 38203 SNPs from the ASE analysis, which corresponds to a Bonferroni threshold of p = 0.05 for a GTE sample size of 395 and an ASE sample size of 188. The p-value cut-offs were adapted so that the same SNP top-list sizes were obtained at all sample sizes for both GTE (p-value of 1.17E-7, 1.06E-4, 1.93E-3, 6.12E-3 for n = 395, n = 188, n = 95, and n = 50 respectively) and ASE (p-value of 8.06E-8, 9.35E-5, 4.90E-3 for n = 188, n = 95, and n = 50 respectively). The vertical axes show the percentage of SNPs in the top-lists detected by both GTE and ASE analysis and the horizontal axes show the number of samples analyzed using GTE and ASE, respectively. The percentage overlap is calculated by dividing the number of overlaps with the number of top SNPs in the GTE analysis. In (A), each line shows the effect on the number of overlapping SNPs detected by ASE analysis of a specific sample size when the sample size in GTE analysis was increased. In (B), each line shows the effect on the number of overlapping rSNPs detected by GTE analysis of a specific sample size when the samples size in ASE analysis is increased.
Figure 2
Figure 2. The ability of ASE and GTE analysis to detect significantly associated rSNPs at different MAF.
Fractions of rSNPs are shown for different minor allele frequencies (MAF) with significant association signals according to a Bonferroni-corrected p-value of 0.05. Each data point underlying the curves represents the fraction of significant associations within a 1% MAF bin. Sliding 5% MAF window averages are plotted for different sample sizes analyzed by ASE and GTE. Both methods detect a lower fraction of low frequency rSNPs, compared to the fraction of all the SNPs at the same frequency (black line). The ASE method detects a higher fraction of the SNPs (solid lines) with a MAF <15% than GTE (dashed lines) regardless of sample size except for the largest GTE sample set.

References

    1. Hindorff LA, Sethupathy P, Junkins HA, Ramos EM, Mehta JP, et al. (2009) Potential etiologic and functional implications of genome-wide association loci for human diseases and traits. Proc Natl Acad Sci U S A 106: 9362–9367. - PMC - PubMed
    1. Visscher PM, Brown MA, McCarthy MI, Yang J (2012) Five years of GWAS discovery. Am J Hum Genet 90: 7–24. - PMC - PubMed
    1. Hindorff LA, MacArthur J, Wise A, Junkins HA, Hall PN, et al.. (2011) A Catalog of Published Genome-Wide Association Studies. Available: www.genome.gov/gwastudies. Accessed 2010 Oct 15.
    1. Cheung VG, Spielman RS, Ewens KG, Weber TM, Morley M, et al. (2005) Mapping determinants of human gene expression by regional and genome-wide association. Nature 437: 1365–1369. - PMC - PubMed
    1. Stranger BE, Forrest MS, Clark AG, Minichiello MJ, Deutsch S, et al. (2005) Genome-wide associations of gene expression variation in humans. PLoS Genet 1: e78. - PMC - PubMed

Publication types