. 2012;7(12):e53003.
doi: 10.1371/journal.pone.0053003. Epub 2012 Dec 27.

Acute hypersensitivity of pluripotent testicular cancer-derived embryonal carcinoma to low-dose 5-aza deoxycytidine is associated with global DNA Damage-associated p53 activation, anti-pluripotency and DNA demethylation

Affiliations

Acute hypersensitivity of pluripotent testicular cancer-derived embryonal carcinoma to low-dose 5-aza deoxycytidine is associated with global DNA Damage-associated p53 activation, anti-pluripotency and DNA demethylation

Bijesh K Biswal et al. PLoS One. 2012.

Abstract

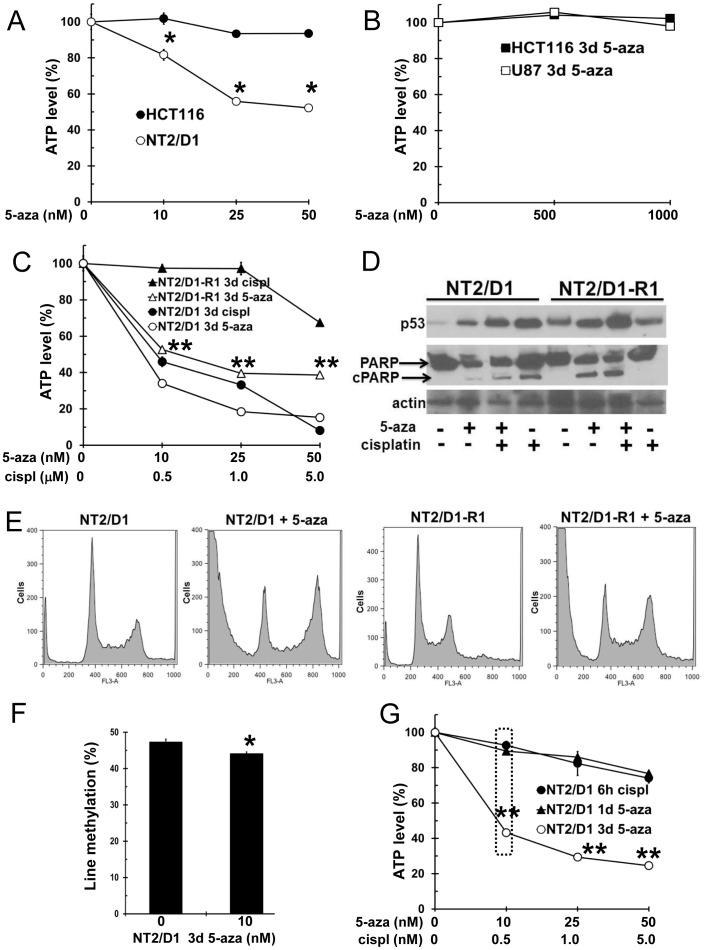
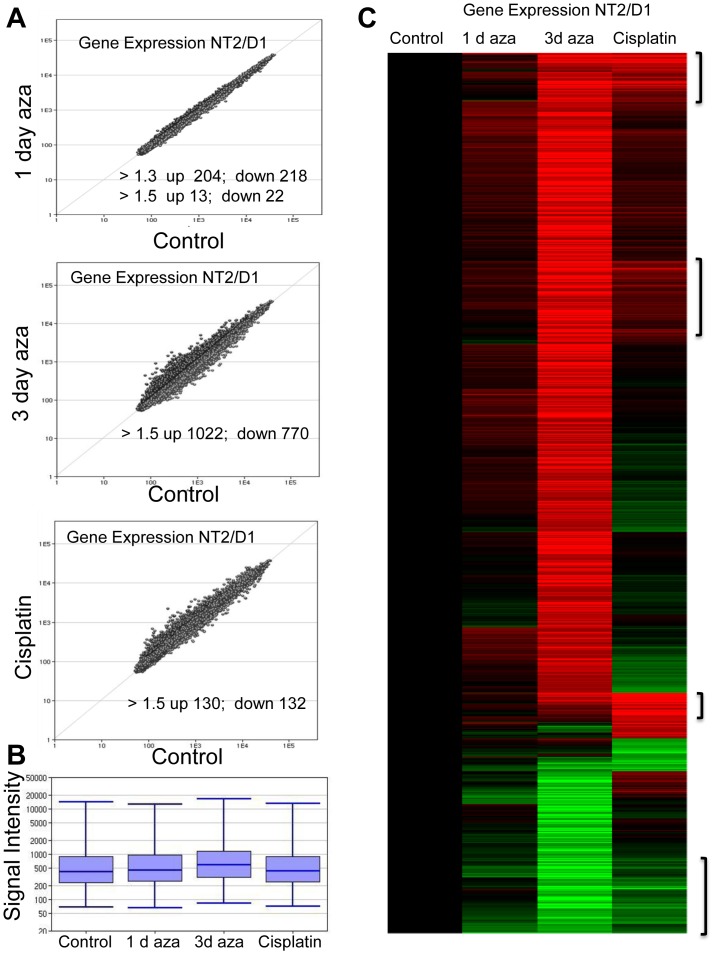
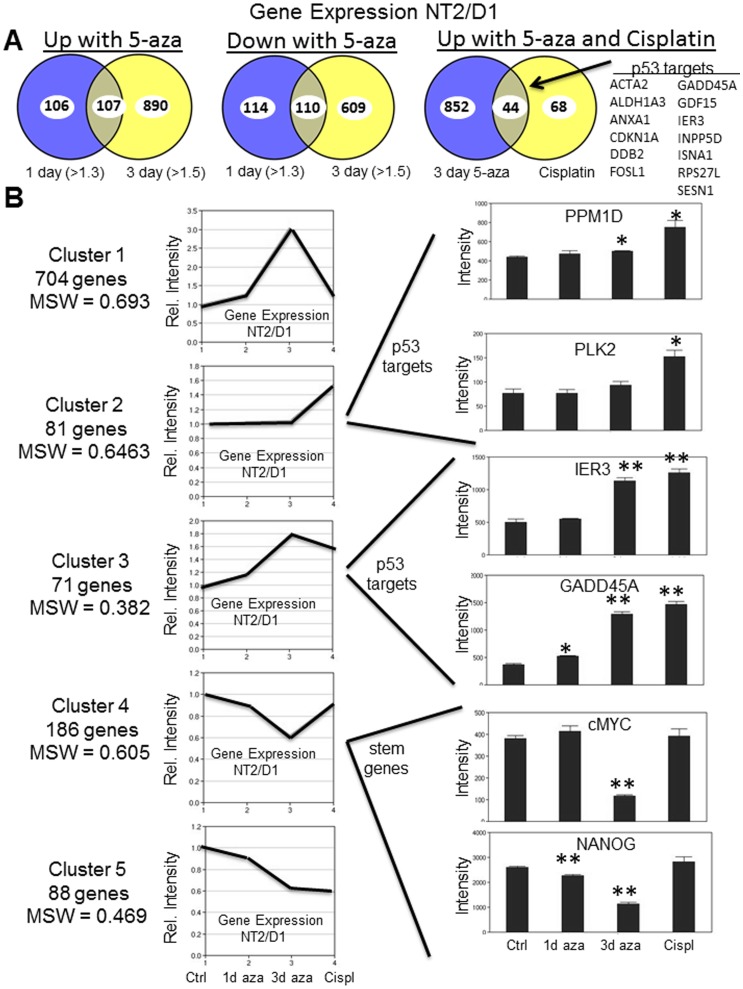
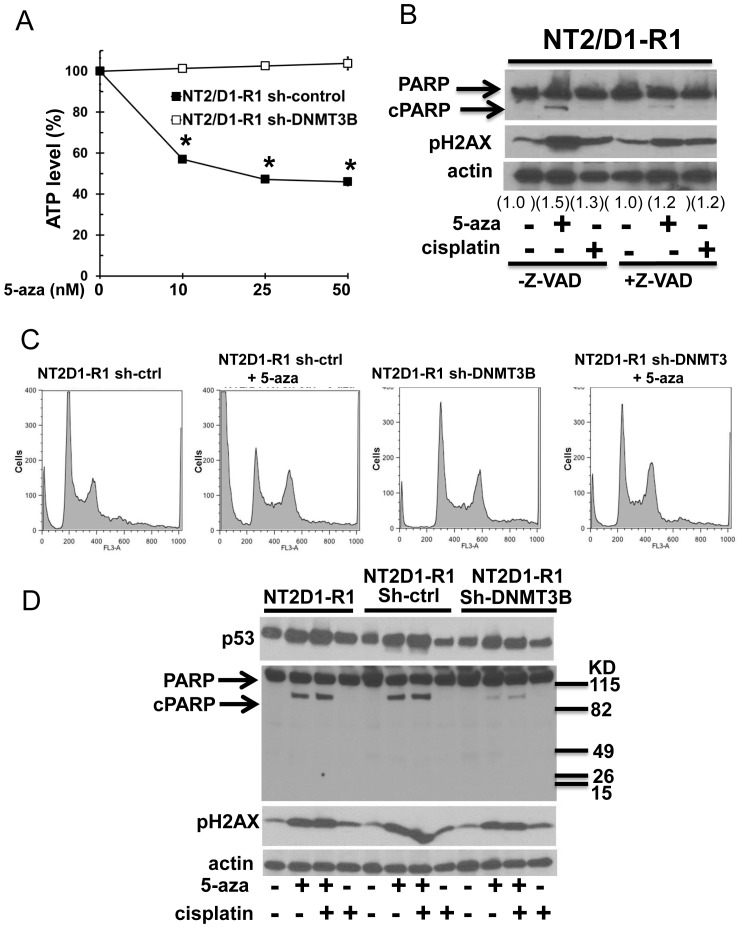
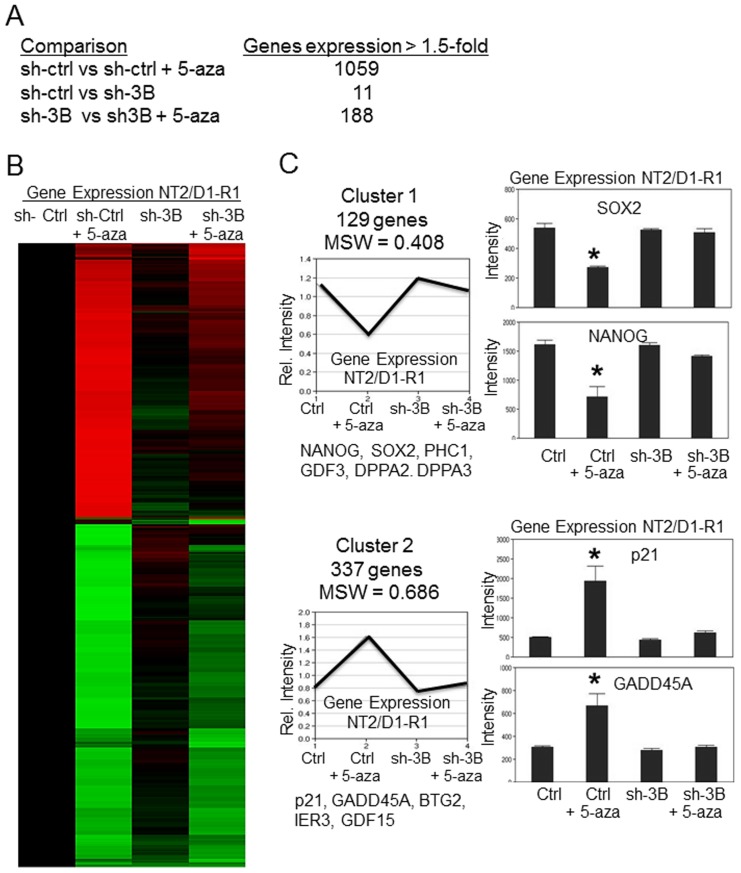
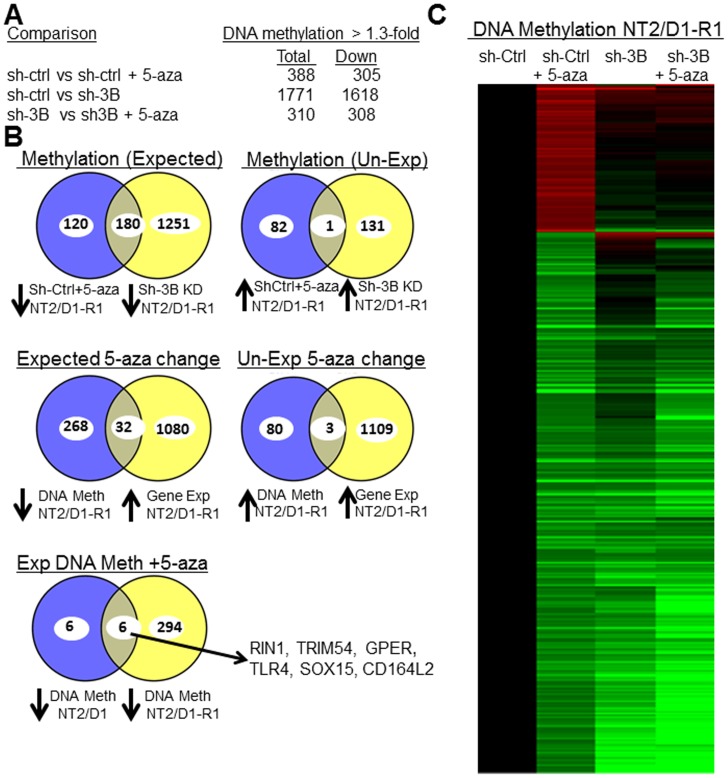
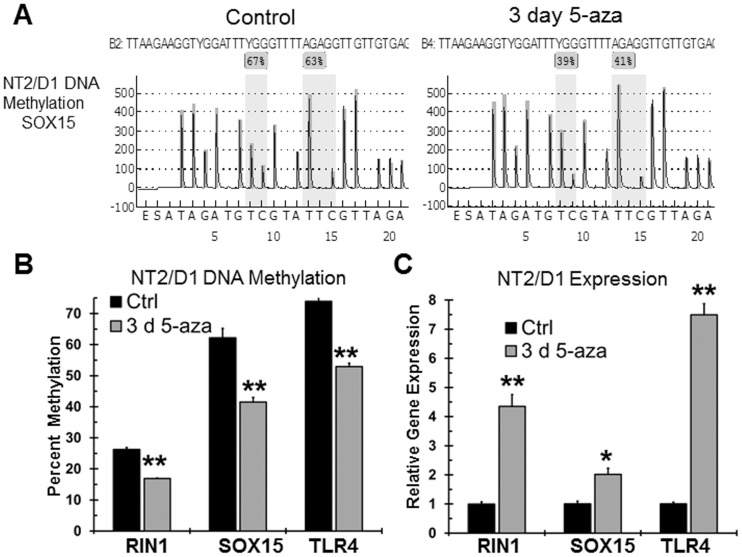
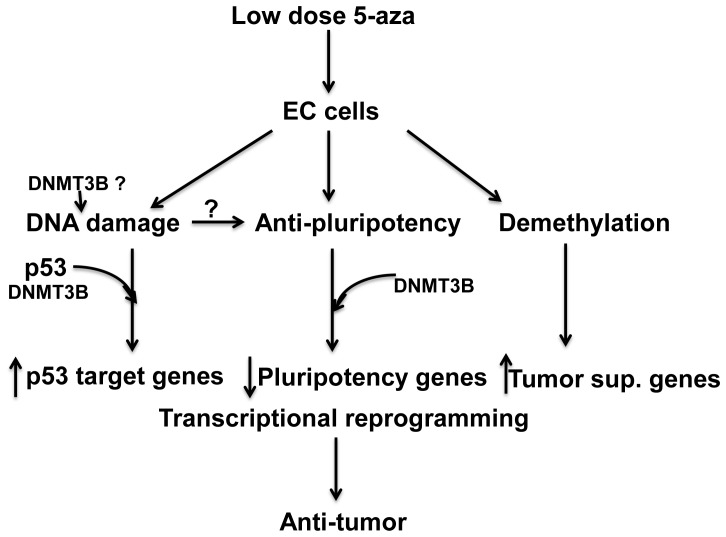
Human embryonal carcinoma (EC) cells are the stem cells of nonseminoma testicular germ cells tumors (TGCTs) and share remarkable similarities to human embryonic stem (ES) cells. In prior work we found that EC cells are hypersensitive to low nanomolar doses of 5-aza deoxycytidine (5-aza) and that this hypersensitivity partially depended on unusually high levels of the DNA methyltransferase, DNMT3B. We show here that low-dose 5-aza treatment results in DNA damage and induction of p53 in NT2/D1 cells. In addition, low-dose 5-aza results in global and gene specific promoter DNA hypomethylation. Low-dose 5-aza induces a p53 transcriptional signature distinct from that induced with cisplatin in NT2/D1 cells and also uniquely downregulates genes associated with pluripotency including NANOG, SOX2, GDF3 and Myc target genes. Changes in the p53 and pluripotency signatures with 5-aza were to a large extent dependent on high levels of DNMT3B. In contrast to the majority of p53 target genes upregulated by 5-aza that did not show DNA hypomethylation, several other genes induced with 5-aza had corresponding decreases in promoter methylation. These genes include RIN1, SOX15, GPER, and TLR4 and are novel candidate tumors suppressors in TGCTs. Our studies suggest that the hypersensitivity of NT2/D1 cells to low-dose 5-aza is multifactorial and involves the combined activation of p53 targets, repression of pluripotency genes, and activation of genes repressed by DNA methylation. Low-dose 5-aza therapy may be a general strategy to treat those tumors that are sustained by cells with embryonic stem-like properties.GEO NUMBER FOR THE MICROARRAY DATA: GSE42647.


Conflict of interest statement

Competing Interests: Carmen Marsit and Brock Christensen are PLOS ONE Editorial Board Members. This does not alter the authors' adherence to all the PLOS ONE policies on sharing data and materials.

Figures

Figure 1
Figure 1. Low-dose 5-aza induces an acute death response in cisplatin sensitive and resistant EC cells.
A–B, The EC line NT2/D1 but not colon cancer HCT116 cells or glioblastoma U87 cells are sensitive to low-dose 5-aza. 5-aza was added for 3 days to exponentially growing cultures. Viable cell growth and survival were measured. C, Cisplatin resistant NT2/D1-R1 cells remain sensitive to low-dose 5-aza. NT2/D1 and NT2/D1-R1 cells were treated with cisplatin for 6 hours and assayed 3 days later or 5-aza was added for 3 days. D, 5-aza induces p53 protein and induces cell death in NT2/D1 and NT2/D1-R1 cells while cisplatin induces p53 protein and cell death only in NT2/D1 cells. Cell were treated with 10 nM 5-aza for 3 days or 1.0 µM cisplatin for 12 hours or the combination and Western analysis performed for p53 and PARP. The arrow indicates cleaved 85 KD PARP that is indicative of apoptosis. E, Treatment with 5-aza results in cell death and G2 cell cycle arrest in NT2/D1 and NT2/D1-R1 cells. Cells were treated with 10 nM 5-aza for 3 days. Substantial cells in subG1 are indicative of cell death. F, Low-dose 5-aza induced global demethylation in NT2/D1 and colon cancer HCT116 cells. Cells were treated with the indicated does of 5-aza for 3 days and methylation of LINE-1 elements were measured by DNA bisulfite-pyrosequencing. G, Viable cell growth and survival of treatment protocols for subsequent expression array analysis. NT2/D1 cells were treated with indicated doses of 5-aza added for 1 or 3 days before harvest or indicated doses of cisplatin for 6 hours follows by 24 hour harvest. Dotted box indicates cell treatments used for expression arrays. All bars and data points are the average of biological triplicates. Error bars are standard deviation and are within the size of the symbols in most cases. * = p<0.05; ** = p<0.005 compared to untreated controls.
Figure 2
Figure 2. Low-dose 5-aza induces an early, robust, and unique reprogramming of gene expression in NT2/D1 cells.
A, Scatter plot of microarray gene expression differences in NT2/D1 cells. Each point represents the average of 3 biological replicates. Points above the diagonal line represent genes upregulated and points below the diagonal line repressed with 1 day 5-aza treatment (top), 3 day 5-aza treatment (middle), and cisplatin treatment (bottom), compared to control. The number of altered genes above the indicated thresholds were changed with p<0.05. B, Robust induction of gene expression occurs with low-dose 5-aza. Box-whisker plot of expression levels of genes (1296) changed among groups >1.2-fold and p<0.02 ANOVA, Benjamini Hochberg (BH) corrected indicated a upward shift in gene expression with 5-aza. C, Low dose 5-aza induced an early and unique program of gene expression compared to cisplatin. Unsupervised hierarchical cluster analysis of the expression profile of 5-aza and cisplatin altered genes was performed on the 898 genes (rows) altered between the samples (columns) more than 1.5-fold with p value<0.01 ANOVA, BH corrected. Upregulated gene are red, downregulated genes are green. Large overlap in 1 day and 3 day 5-aza treatments and distinct regulation compared to cisplatin is evident. Genes regulated in a similar manner by 5-aza and cisplatin are in brackets.
Figure 3
Figure 3. Low-dose 5-aza induces distinct genome-wide activation of p53 target genes and unique repression of pluripotency genes in NT2/D1 cells.
A, Venn diagrams of expression microarray data from Figure 2 indicating a large overlap in the genes upregulated (left) and down regulated (middle) in NT2/D1 cells with 1 day 5-aza treatment (fold change >1.3) compared to 3 day 5-aza treatment (fold change >1.5). A Venn diagram (right) of microarray data from Figure 2 showing a large degree of overlap in genes upregulated 1.5-fold or greater by both 3 day 5-aza and cisplatin treatments. Genes listed in each Venn diagram are altered with p<0.05. Of the overlap genes, 13 are known p53 target genes in NT2/D1 cells. B, Partitioning around mediods (PAM) analysis of 5-aza and cisplatin regulated genes in NT2/D1 cells. The 1130 genes changed 1.5-fold or greater with BH corrected p-value of <0.02 were subjected to PAM analysis as described in Methods. The number of genes in each of the five clusters and the mean silhouette width (MSW) value for each cluster is indicated. Expression intensity values for representative genes in Cluster 2, Cluster 3, and Cluster 4 is provided on the left. Error bars are S.E.M. * = p<0.05; ** = p<0.005 compared to untreated controls.
Figure 4
Figure 4. Knockdown of DNMT3B results in resistance to low-dose 5-aza downstream of DNA damage and p53 protein induction.
A, DNMT3B knockdown in NT2/D1-R1 cells leads to resistance to low-dose 5-aza. Indicated doses of 5-aza were added fresh each day for 3 days to exponentially growing cultures of NT2/D1-R1 lentiviral control cells and NT2/D1-R1 cells stably expressing a lentiviral shDNMT3B construct. Viable cell growth and survival were measured. Data was normalized to no drug treatment. Error bars (within symbols) are standard deviation. * p = <0.05 compared to untreated controls. B, Low dose 5-aza induces DNA damage in NT2/D1-R1 cells independent of apoptosis. Cells were pretreated with vehicle or 20 µM Z-VAD-FMK (z-VAD) and treated with 100 nM 5-aza or 2 µM cisplatin for 1 day prior to Western analysis. Accumulation of pH2AX is indicative of double strand breaks. The arrow labeled cPARP indicates cleaved PARP that is indicative of apoptosis. Densitometry of pH2AX normalized to actin is shown. C, DNMT3B knockdown in NT2/D1-R1 cells results in resistant to low-dose 5-aza induced cell death and G2 cell cycle arrest. Cells were treated with 10 nM 5-aza for 3 days and then assayed for cell cycle analysis. Substantial cells in subG1 are indicative of cell death. D, Knockdown of DNMT3B in NT2/D1-R1 cells inhibits low-dose 5-aza mediated cell death but not p53 protein induction or induction of DNA damage. NT2/D1-R1 cells with no lentivirus and cells treated with sh-control lentvirus and sh-DNMT3B lentivirus were treated with 10 nM 5-aza for 3 days, 1 µM cisplatin for 12 hours or the combination. Western analysis was performed for p53, PARP and pH2AX.
Figure 5
Figure 5. DNMT3B knockdown inhibits low-dose 5-aza mediated genome-wide activation of p53 target genes and repression of pluripotency genes.
A, Summary of results from expression microarray data of NT2/D1-R1 sh-control cells (sh-ctrl) and NT2/D1-R1 sh-DNMT3B cells (sh3B) untreated or treated for 3 days with 10 nM 5-aza. Knockdown of DNMT3B greatly reduced the number of genes altered with 5-aza treatment while DNMT3B knockdown alone results in minimal expression changes. The number of genes altered was based on the average of 3 biological replicates with 1.5-fold or greater change and a p value<0.01. B, Unsupervised hierarchical cluster analysis of the expression data in (A) was performed on the 541 genes altered more than 1.8-fold with p value<0.01 ANOVA BH corrected, between NT2/D1-R1 sh-control cells (sh-ctrl) and NT2/D1-R1 sh-DNMT3B cells (sh3B) untreated or treated for 3 days with 10 nM 5-aza. Upregulated gene are red, downregulated genes are green. C, Partitioning around mediods (PAM) analysis of 1169 genes changed 1.5-fold or greater with BH corrected p-value of <0.01. Cluster 1 and Cluster 2 of 6 total clusters are shown. All clusters are provided in supplemental Fig S4. The number of genes in the clusters and the mean silhouette width (MSW) value is indicated. Expression intensity values for representative genes in Cluster 1 (pluripotent genes) and Cluster 2 (p53 target genes) is provided on the right and additional prominent members are provided below each cluster. Error bars are S.E.M. * = p<0.05 compared to untreated control.
Figure 6
Figure 6. Low-dose 5-aza and DNMT3B knockdown alters genome-wide promoter demethylation in NT2/D1-R1 cells.
A, Summary of results from Illumina 27K beadchip DNA promoter methylation analysis of NT2/D1-R1 sh-control cells (sh-ctrl) and NT2/D1-R1 sh-DNMT3B cells (sh3B) untreated or treated for 3 days with 10 nM 5-aza. The number of promoter methylation alterations was based on the average of 3 replicates with 1.3-fold or greater change and a p value<0.05. B, Venn diagrams depicting degree of overlap in genes altered in expression or DNA promoter methylation in NT2/D1-R1 cells due to low dose 5-aza or DNMT3B knockdown. Top, High degree of overlap in genes in NT2/D1-R1 cells demethylated with low dose 5-aza and demethylated with DNMT3B knockdown (left). Little overlap in genes in NT2/D1-R1 cells undergoing increased DNA methylation with low dose 5-aza and increased DNA methylation with DNMT3B knockdown (right). The numbers represent methylation changes of 1.3-fold or greater with p<0.05. Middle, A moderate degree of overlap in genes in NT2/D1-R1 cells that underwent decreased DNA methylation and increased gene expression with 5-aza (left) and little overlap in genes in NT2/D1-R1 cells that underwent increased DNA methylation and increased gene expression with 5-aza. The numbers represent methylation changes of 1.3-fold or greater with p<0.05 and expression changes of 1.5-fold or greater with p<0.01. Bottom, A large degree of overlap in genes demethylated after 5-aza treatment of NT2/D1 and NT2/D1-R1 cells. The six overlapping genes are shown. The numbers represent methylation changes of 1.3-fold or greater with p<0.05. C, Unsupervised hierarchical clustering of the promoter DNA methylation of the 4 treatment arm values among just the 388 genes changed 1.3-fold or greater, p value<0.05 with 5-aza in the control cells depicting the large degree of overlap in genes undergoing demethylation with 5-aza and DNMT3B knockdown. Increased methylation = red, decreased methylation = green.
Figure 7
Figure 7. Confirmation of promoter DNA demethylation with low-dose 5-aza in NT2/D1 cells.
A, Representative bisulfite pyrosequencing tracing from NT2/D1 cells treated with vehicle control or 10 nM 5-aza for 3 days in the promoter region of SOX15. Shaded areas are CpG sites. B, Decrease in DNA methylation of the RIN1, SOX15 and TLR4 promoter with 3 day 10 nM 5-aza treatment of NT2/D1 cells as determined by bisulfite pyrosequencing. Average of biological triplicate determinations. Error bars are standard deviation. ** = p<0.005. SOX15 values represent the average methylation value across two CpG sites. RIN1 and TRL4 values represent the average methylation across three CpG sites. C, Increased gene expression of RIN1, SOX15 and TLR4 with 3 day 10 nM 5-aza treatment of NT2/D1 cells as determined by real-time PCR. Average of biological triplicate determinations. Error bars are standard deviation. * = p<0.05; ** = p<0.005.
Figure 8
Figure 8. Model of mechanisms of low-dose 5-aza hypersensitivity in EC cells.
Low dose 5-aza effects on EC cells are multifactorial and include induction of DNA damage, p53 activation, DNA promoter demethylation, and repression of pluripotency genes. Proposed DNMT3B-dependent effects based largely on microarray analysis is indicated along with speculative role of DNMT3B in altering composition of DNA adducts. Prior direct repression of pluripotency factors by DNA damage is not supported by the current study.

References

    1. Einhorn LH (2002) Curing metastatic testicular cancer. Proc Natl Acad Sci USA 99: 4592–4595. - PMC - PubMed
    1. Koychev D, Oechsle K, Bokemeyer C, Honecker F (2011) Treatment of patients with relapsed and/or cisplatin-refractory metastatic germ cell tumours: an update. Int J Androl 34: e266–273. - PubMed
    1. Efstathiou E, Logothetis CJ (2006) Review of late complications of treatment and late relapse in testicular cancer. J Natl Compr Canc Netw 4: 1059–1070. - PubMed
    1. Kristensen DM, Sonne SB, Ottesen AM, Perrett RM, Nielsen JE, et al. (2008) Origin of pluripotent germ cell tumours: the role of microenvironment during embryonic development. Mol Cell Endocrinol 288: 111–118. - PubMed
    1. Clark AT (2007) The stem cell identity of testicular cancer. Stem Cell Rev 3: 49–59. - PubMed

Publication types

MeSH terms

Associated data