. 2012 Dec;2(12):3242-68.
doi: 10.1002/ece3.425. Epub 2012 Nov 15.

Human-induced marine ecological degradation: micropaleontological perspectives

Affiliations

Human-induced marine ecological degradation: micropaleontological perspectives

Moriaki Yasuhara et al. Ecol Evol. 2012 Dec.

Abstract

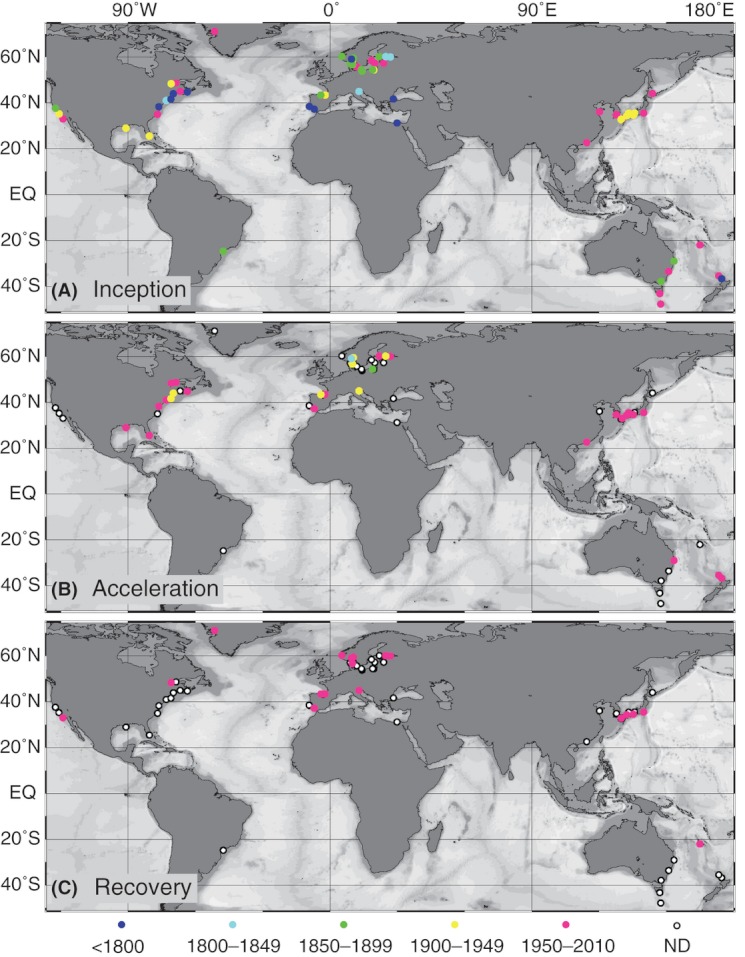
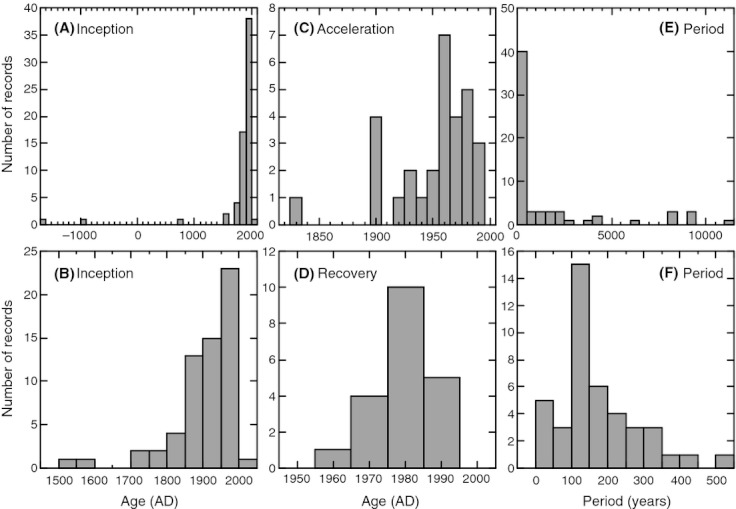
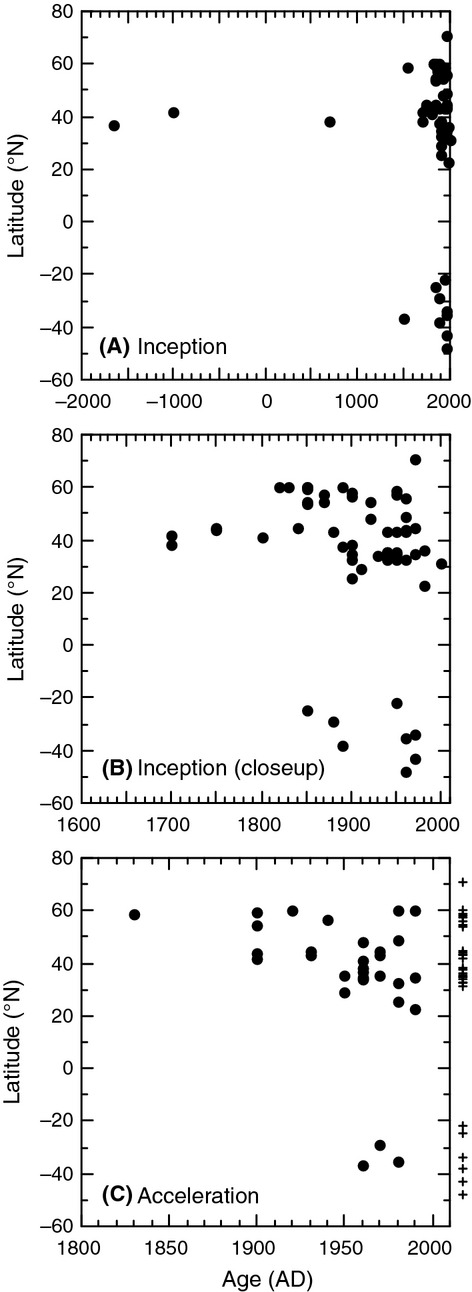
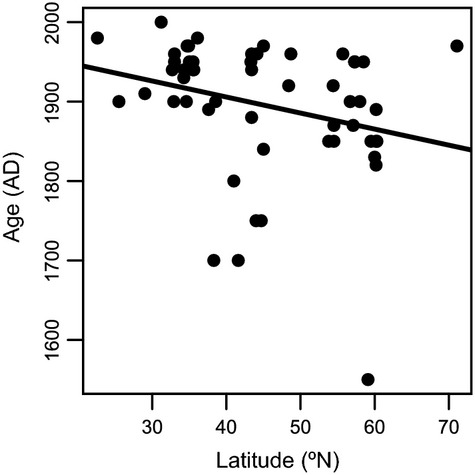
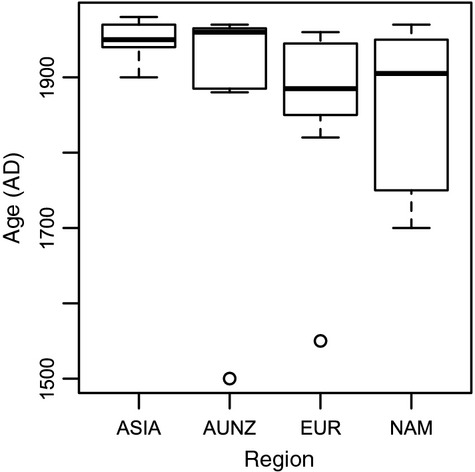
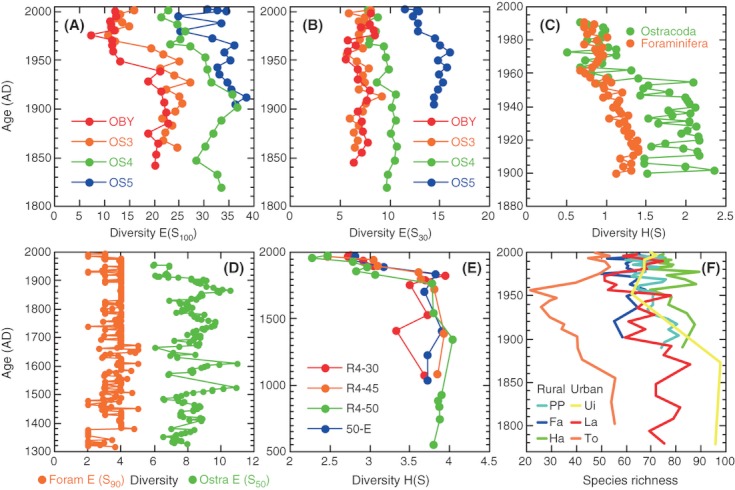
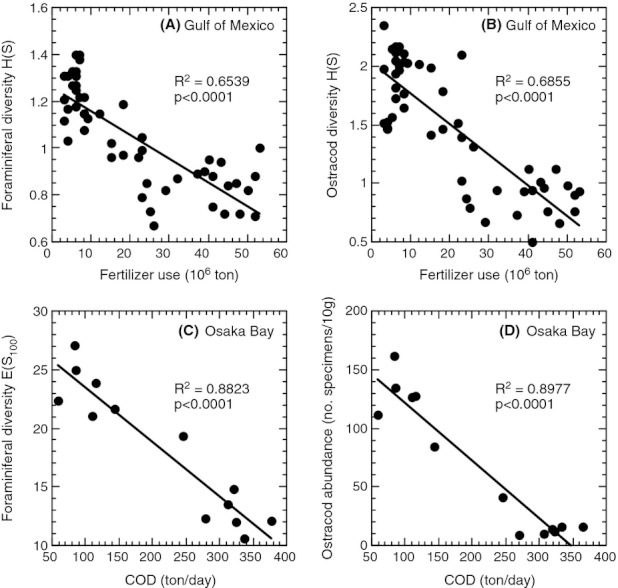
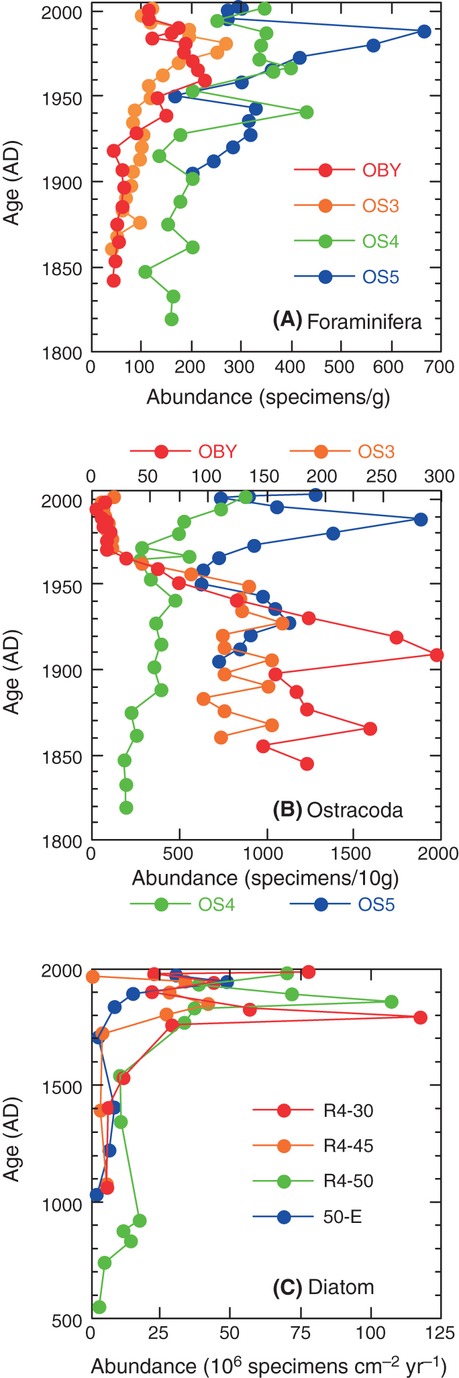
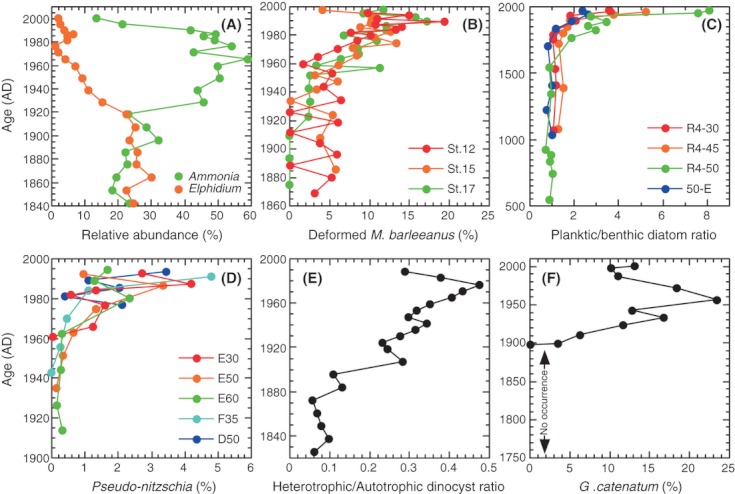
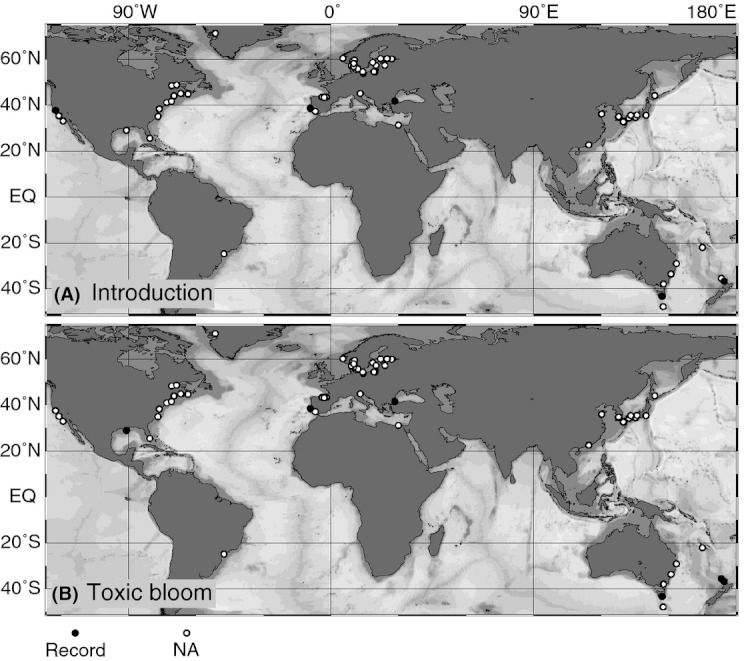
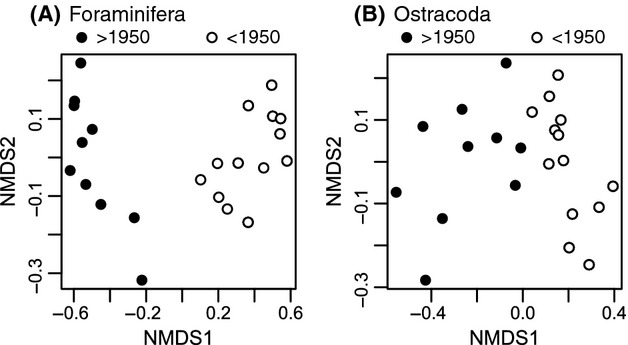
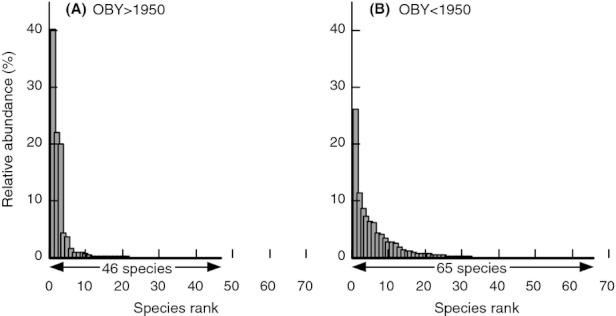
We analyzed published downcore microfossil records from 150 studies and reinterpreted them from an ecological degradation perspective to address the following critical but still imperfectly answered questions: (1) How is the timing of human-induced degradation of marine ecosystems different among regions? (2) What are the dominant causes of human-induced marine ecological degradation? (3) How can we better document natural variability and thereby avoid the problem of shifting baselines of comparison as degradation progresses over time? The results indicated that: (1) ecological degradation in marine systems began significantly earlier in Europe and North America (∼1800s) compared with Asia (post-1900) due to earlier industrialization in European and North American countries, (2) ecological degradation accelerated globally in the late 20th century due to post-World War II economic growth, (3) recovery from the degraded state in late 20th century following various restoration efforts and environmental regulations occurred only in limited localities. Although complex in detail, typical signs of ecological degradation were diversity decline, dramatic changes in total abundance, decrease in benthic and/or sensitive species, and increase in planktic, resistant, toxic, and/or introduced species. The predominant cause of degradation detected in these microfossil records was nutrient enrichment and the resulting symptoms of eutrophication, including hypoxia. Other causes also played considerable roles in some areas, including severe metal pollution around mining sites, water acidification by acidic wastewater, and salinity changes from construction of causeways, dikes, and channels, deforestation, and land clearance. Microfossils enable reconstruction of the ecological history of the past 10(2)-10(3) years or even more, and, in conjunction with statistical modeling approaches using independent proxy records of climate and human-induced environmental changes, future research will enable workers to better address Shifting Baseline Syndrome and separate anthropogenic impacts from background natural variability.

Keywords: Eutrophication; hypoxia; marine ecosystems; microfossils; pollution; species diversity.


Figures

Figure 1
Figure 1
Global distribution of marine ecological degradations in downcore microfossil records. Complete data are found in Table S1. Distribution of (A) inception, (B) acceleration, and (C) recovery ages [five categories of <1800 (blue), 1800–1849 (light blue), 1850–1899 (green), 1900–1949 (yellow), and 1950–2010 (pink)] of marine ecological degradation detected in microfossil records. ND (open circle): not detected.
Figure 2
Figure 2
Age distribution of microfossil-based marine ecological degradation records. Histograms showing distribution of (A; B for closeup) inception, (C) acceleration, and (D) recovery ages of marine ecological degradations and of (E; F for closeup) covering period of microfossil records. Data from Table S1.
Figure 3
Figure 3
Latitudinal distribution of microfossil-based marine ecological degradation records. Latitude versus inception (A; B for closeup) and acceleration ages (C) of marine ecological degradation. Cross: locations lacking detectable acceleration. Data from Table S1.
Figure 4
Figure 4
Relationship between latitude and the inception dates of marine ecological degradation in the northern hemisphere (R2 = 0.07362, P = 0.0494). Only inception dates >1000 AD were used.
Figure 5
Figure 5
Boxplots showing regional differences of the inception dates of marine ecological degradation. ASIA: Asia; AUNZ: Australia and New Zealand; EUR: Europe; NAM: North America. Asian inception dates are significantly later than European (W = 261, P = 0.0008) and North American (W = 144, P = 0.0105) inception dates (but not significantly different from AUNZ inception dates: W = 36, P = 0.47). Only inception dates >1000 AD were used.
Figure 6
Figure 6
Long-term downcore trends of microfossil species diversity in representative regions from which high-resolution records are available. (A) Osaka Bay foraminiferal [data from Tsujimoto et al. (2008); OBY, OS3, OS4, and OS5: sediment core sites; cores OBY and OS3 were taken from inner part and cores OS4 and OS5 were taken from middle part of the bay], (B) Osaka Bay ostracod [data from Yasuhara et al. (2007)], (C) Gulf of Mexico foraminiferal (Blackwelder et al. 1996) and ostracod (Alvarez Zarikian et al. 2000), (D) Chesapeake Bay foraminiferal [data from Karlsen et al. (2000)] and ostracod [data from Cronin and Vann (2003)], (E) Chesapeake Bay diatom (Cooper 1995) (R4-30, R4-45, R4-50, and 50-E: sediment core sites), and (F) Baltic Sea diatom (Weckström et al. 2007) (PP, Fa, and Sa: rural sites; Ui, La, and To: urban sites) records. Species diversity shown by species richness, Shannon Index H(S), or the expected number of species in samples rarefied to n individuals E(Sn) depending on availability.
Figure 7
Figure 7
Relationship between eutrophication and species diversity and abundance. Correlations between (A) foraminiferal diversity H(S) in Gulf of Mexico core BC-10 and fertilizer use in USA, (B) ostracod diversity H(S) in Gulf of Mexico core BC-10 and fertilizer use in USA, (C) foraminiferal diversity E(S100) in Osaka Bay core OS3 and discharges of COD (chemical oxygen demand) from Osaka Prefecture, and (D) ostracod abundance (number of specimens per 10 g dry sediment) in Osaka Bay core OS3 and discharges of COD from Osaka Prefecture. Gulf of Mexico data from Alvarez Zarikian et al. (2000); Osaka Bay data from Yasuhara et al. (2007) and Tsujimoto et al. (2008).
Figure 8
Figure 8
Long-term downcore trends of microfossil abundance in representative regions from which high-resolution records are available. (A) Osaka Bay foraminiferal (Tsujimoto et al. 2008) and (B) Osaka Bay ostracod (Yasuhara et al. 2007) records (OBY, OS3, OS4 and OS5: sediment core sites; cores OBY and OS3 were taken from inner part and cores OS4 and OS5 were taken from middle part of the bay) and (C) Chesapeake Bay diatom records (Cooper 1995) (R4-30, R4-45, R4-50, and 50-E: sediment core sites). In Osaka Bay, ostracode abundance decreases in the inner part of the bay but increases in the central part of the bay, because Osaka Bay hypoxia is restricted in the inner part of the bay (see Overview of Regional Trends section for mechanism of abundance change).
Figure 9
Figure 9
Representative downcore faunal and floral changes. Relative abundance of foraminiferal genera, Ammonia and Elphidium, in core OBY, Osaka Bay (Tsujimoto et al. 2008) (A); relative abundance of deformed specimens of foraminiferal species, Melonis barleeanus in sediment cores St. 12, St. 15, and St. 17 in a Greenlandic fjord (Elberling et al. 2003) (B); Planktic/benthic diatom ratio in Chesapeake Bay cores R4-30, R4-45, R4-50, and 50-E (Cooper 1995) (C); relative abundance of toxic diatom genus, Pseudo-nitzschia, in Gulf of Mexico cores E30, E50, E60, F35, and D50 (Parsons and Dortch 2002) (D); Heterotrophic/Autotrophic ratio of dinoflagellate cysts in the Adriatic Sea (Sangiorgi and Donders 2004) (E); and relative abundance of introduced dinoflagellate species, Gymnodinium catenatum, in Portuguese Margin, North Atlantic (Amorim and Dale 2006) (F).
Figure 10
Figure 10
Global distribution of marine ecological degradation in downcore microfossil records. Distribution of (A) introduction and (B) toxic bloom events. NA: site with no introduction or toxic bloom evidence. Data from Table S1.
Figure 11
Figure 11
Ordination (NMDS) of microfossil relative abundance data in Osaka Bay core OS3. (A) foraminifera. (B) ostracods. Solid circles: post-1950 samples. Open circles: pre-1950 samples. Data from Tsujimoto et al. (2008) and Yasuhara et al. (2007).
Figure 12
Figure 12
Rank-abundance distributions of foraminifera in Osaka Bay core OBY. (A) post-1950 assemblage (46 species in total). (B) pre-1950 assemblage (65 species in total). Data from Tsujimoto et al. (2008).

References

    1. Abe K. Population structure of Keijella bisanensis (Okubo) (Ostracoda, Crustacea) – An inquiry into how far the population structure will be preserved in the fossil record. J. Fac. Sci., Univ. Tokyo. Sec. II, Geol. Mineral. Geogr. Geophys. 1983;20:443–488.
    1. Airoldi L, Beck MW. Loss, status and trends for coastal marine habitat of Europe. Oceanogr. Mar. Biol. Annu. Rev. 2007;45:345–405.
    1. Akimoto K, Nakamura K, Kondo H, Ishiga H, Dozen K. Environmental reconstruction based on heavy metals, diatoms and benthic foraminifes in the Isahaya reclamation area, Nagasaki, Japan. Environ. Micropaleontol., Microbiol. and Meiobenthol. 2004;1:83–104.
    1. Allen AP, Brown JH, Gillooly JF. Global biodiversity, biochemical kinetics, and the energetic-equivalence rule. Science. 2002;297:1545–1548. - PubMed
    1. Alvarez Zarikian CA, Blackwelder PL, Hood T, Nelsen TA, Featherstone C. 2000. pp. 896–905. Ostracods as indicators of natural and anthropogenically-induced changes in coastal marine environments. Coasts at the Millennium, Proceedings of the 17th International Conference of The Coastal Society, Portland, OR USA, July 9-12.

LinkOut - more resources